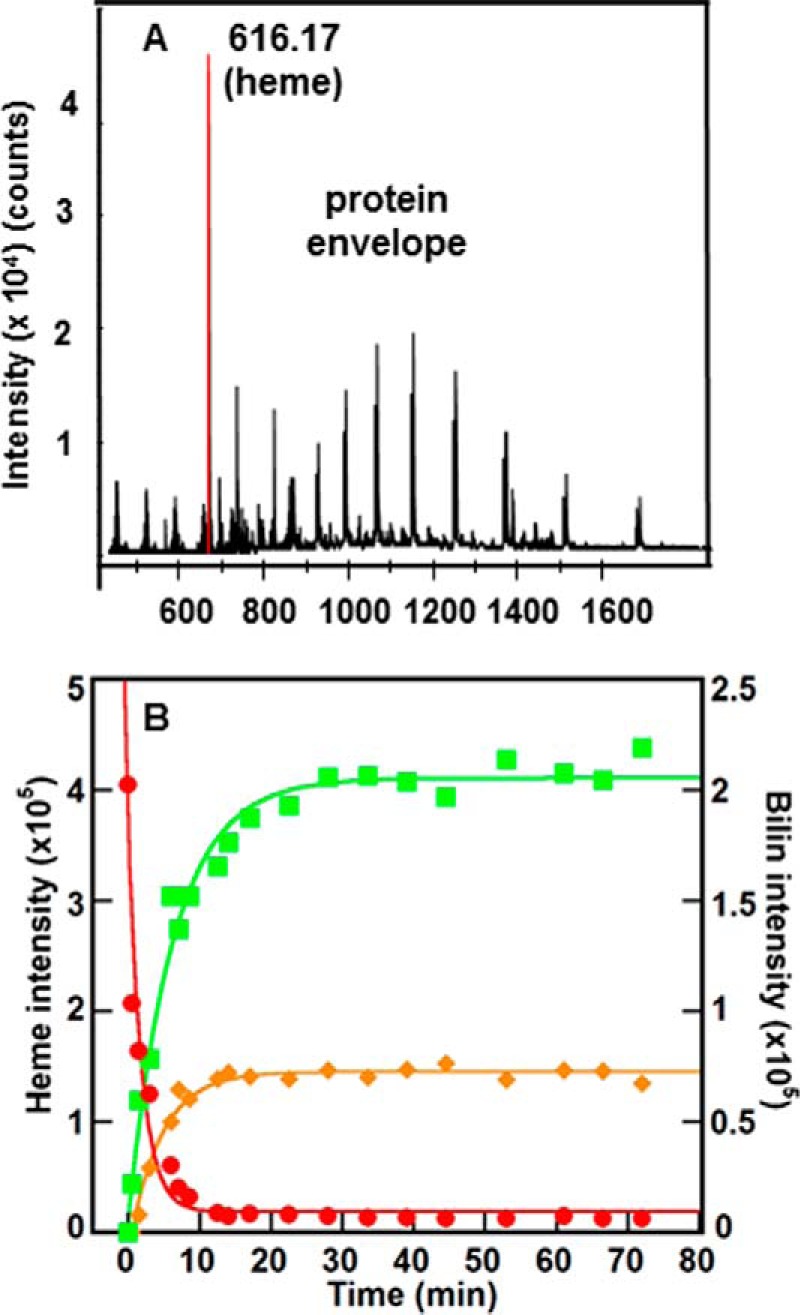
FIGURE 3.

IsdG reaction was monitored using time resolved in proteo MS. A, mass spectrum was measured at t = 0, showing the heme (616.17 Da) and protein envelope. B, integrated intensities of the extracted ion chromatograms (m/z ± 0.01) measured over time for the species with exact masses 616.17 (red), 611.24 (green), and 599.24 (orange) Da. Intensities for the 616.17 Da species (heme) are given on the left y axis; intensities for the other two species are given on the right y axis. The data were fit to single exponential curves as described in the text. Data from a representative experiment are shown; reported rate constants are the average of three values. Conditions were the same as reported in Fig. 2A.
