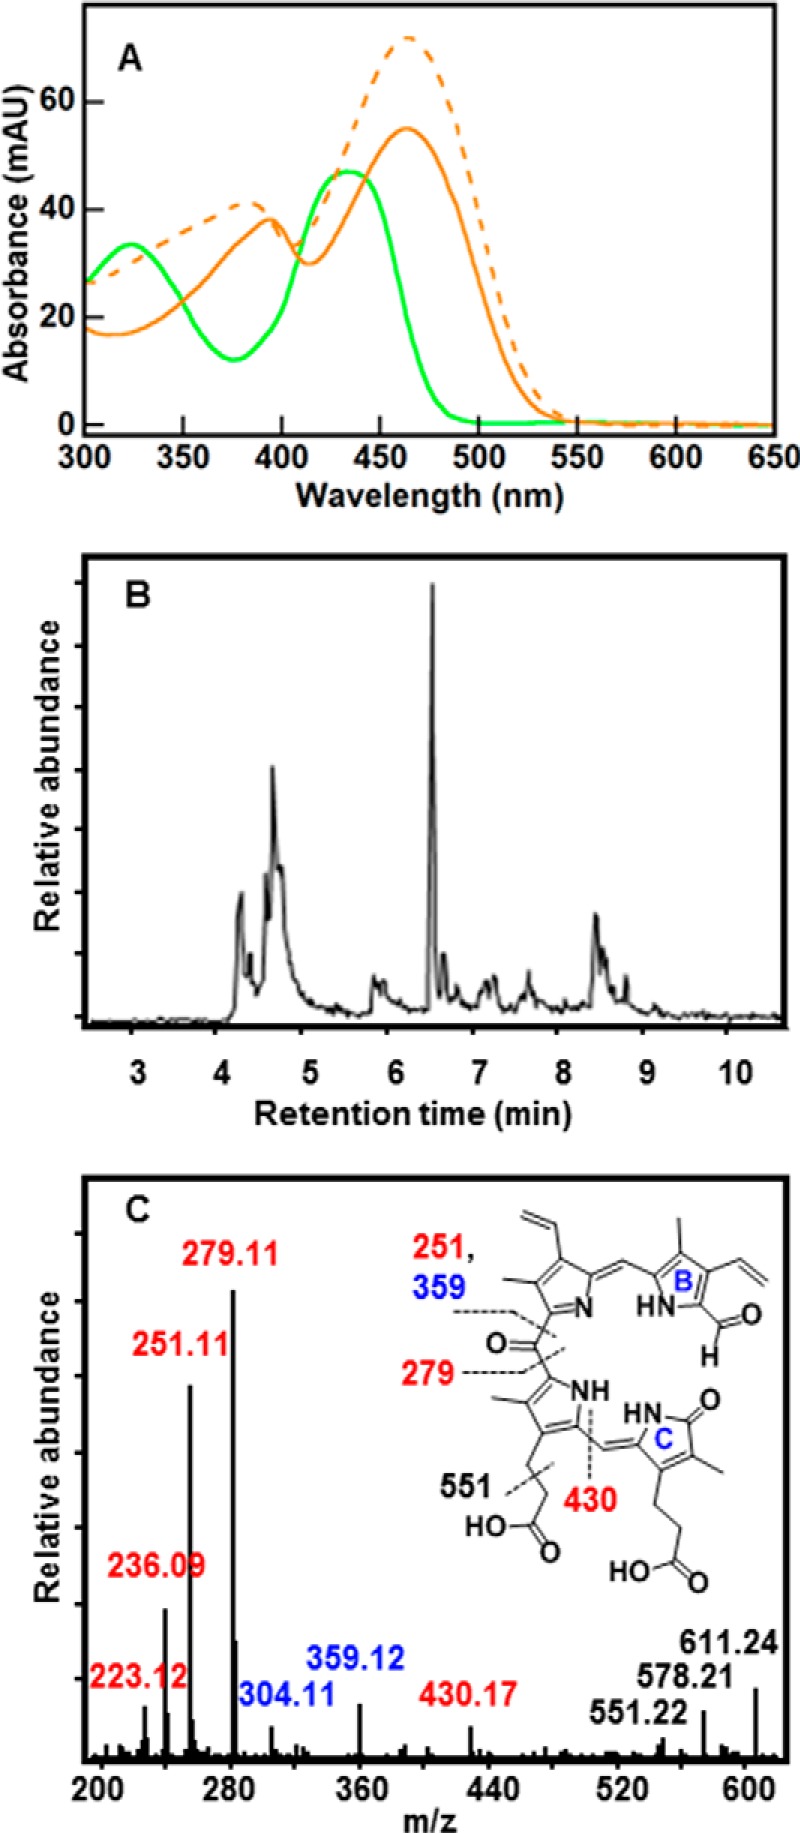
FIGURE 5.

UV/vis and LC-MS reveal a series of formyloxobilin isomers that are distinct from staphylobilins. A, UV/vis spectrum for the formyloxobilin isomer mixture (green) has two broad peaks with maxima at 324 and 435 nm. Spectra for the δ- and β-staphylobilin isomers resolved by UPLC (dashed and solid orange lines, respectively) are shown for comparison. Consistent with prior work (17), these had peak maxima at 383 and 463 nm (δ-staphylobilin, the product of cleavage at the δ-meso-carbon) and 394 and 463 nm (β-staphylobilin). MAU, milliabsorbance units. B, extracted ion chromatogram for m/z 611.24 measured 30 min after initiating the IsdG-mediated heme decomposition reaction (10 μm IsdG-heme, 10 mm ascorbate, 50 mm KPi, pH 7.4, 22 °C, 100 units of catalase). C, CID MS/MS fragmentation pattern of the 611.24 ion eluted at 6.6 min is shown. The presence of signature ions m/z = 279.11, [M]+ and m/z = 251.11, [M]+ indicates a formyl group appended to either ring A or B (cleavage at the β- and δ-meso carbons cannot be distinguished). Ion labels are color-coded to match fragments containing formyl (red), oxo (blue), or both (black). Inset, fragmentation map of 10-formyl,11-oxobilin with indicated cleavage sites generated during CID.
