FIGURE 3.
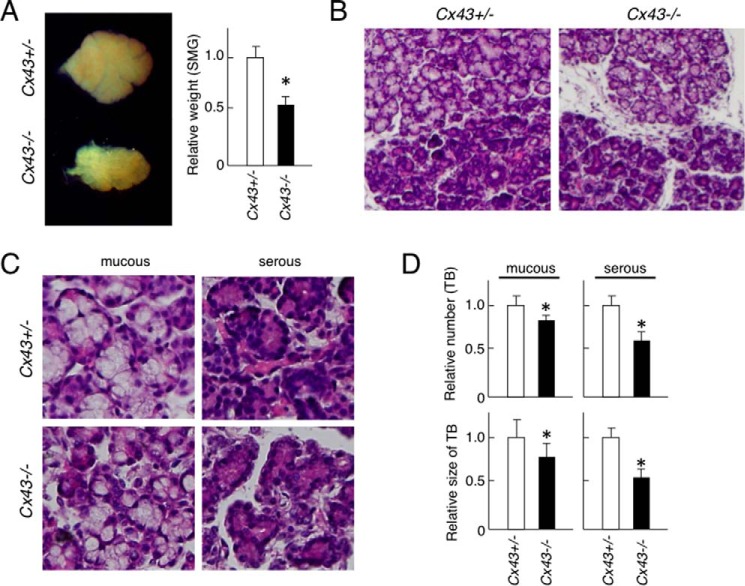
Phenotype of SMG in Cx43−/− mice. A, stereomicroscope image of SMGs from P1 C43+/− and Cx43−/− mice. The graph shows relative weights of the SMGs, with the weight of the Cx43± specimens set at a value of 1.0 for comparison. B, hematoxylin-eosin staining of SMGs from C43+/− and Cx43−/− mice. C, high magnification image of mucous and serious glands from SMGs of each mouse strain. D, relative numbers of terminal buds (TB) in mucous and serous glands in SMGs of C43+/− and Cx43−/− mice, with the number found in the Cx43+/− SMG specimens set at a value of 1.0 for comparison. Statistical analysis was performed using ANOVA (n = 5 per group; *, p < 0.01).

