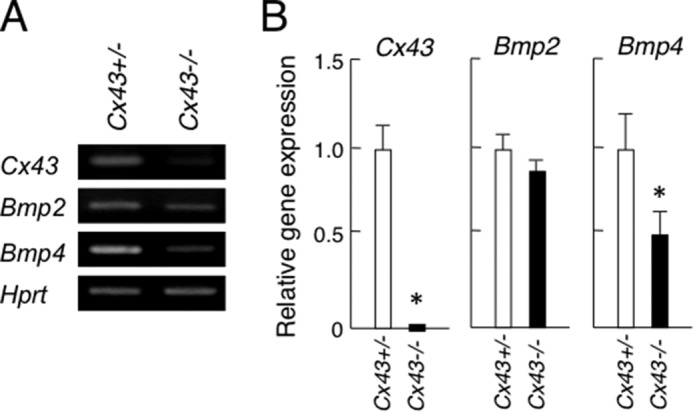
FIGURE 5.

Expression of Cx43, Bmp2, and Bmp4 in SMGs from C43+/− and Cx43−/−mice. A, mRNA expression of Cx43, Bmp2, and Bmp4 were analyzed by RT-PCR. B, expression level of each gene was quantified using bands of the PCR products and compensated using hypoxanthine phosphoribosyltransferase (Hprt) as the internal control. Statistical analysis was performed using ANOVA (n = 3 per group; *, p < 0.01).
