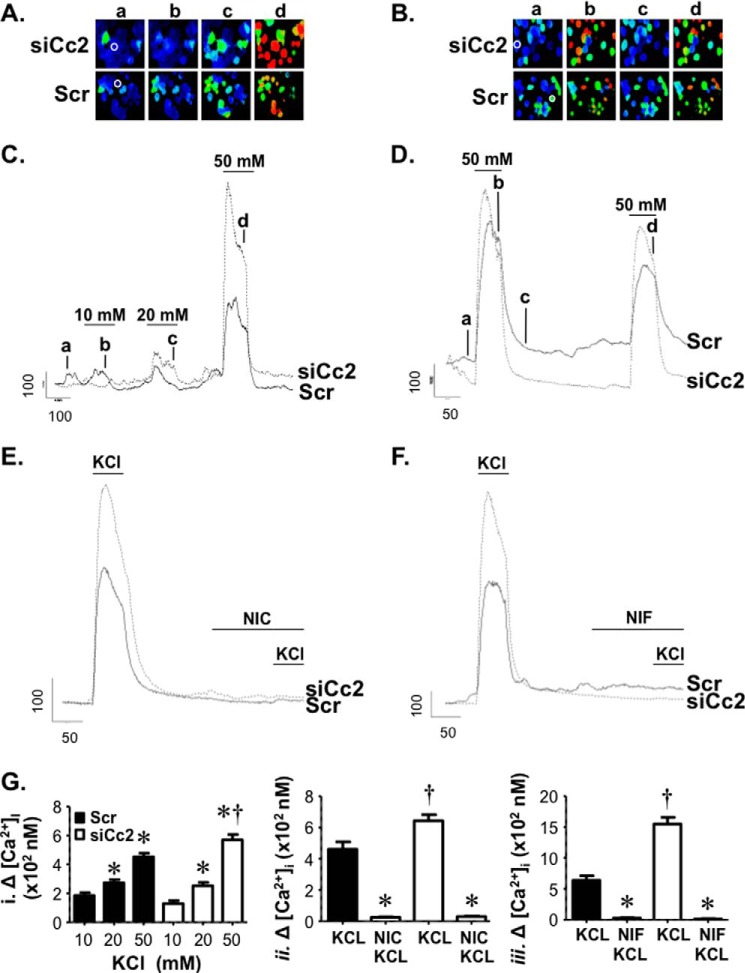
FIGURE 7.
CEACAM2 regulates GLP-1 secretion through L-type voltage-dependent Ca2+ channels. A and B, GLUTag cells were loaded with Fura-2 AM, and images were obtained. The ratio images illustrate [Ca2+]i rises in individual cells in a field of view following membrane depolarization evoked by applying elevated concentrations of KCl (10, 20, and 50 mm) (A) and two sequential stimulations with 50 mm KCl (B) in both scrambled (Scr) and si-RNA Ceacam2 transfected (siCc2) cells. C–F, representative line traces from cells in A and B (indicated by white circles) depict [Ca2+]i responses in GLUTag cells evoked by KCl (10, 20, and 50 mm) or sequential applications of 50 mm KCl. To assess VDCC contribution to the depolarization-evoked rises in cytosolic Ca2+, 50 mm KCl was applied prior to and following treatment with 10 μm of the L-type calcium channel blockers, nicardipine (NIC) and nifedipine (NIF), as indicated. Scale bars indicate fluorescence ratio units (r.u.) and time in seconds. G, bar graphs of the averaged changes in [Ca2+]i in GLUTag cells stimulated by physiological saline containing the indicated concentrations of KCl (10, 20, and 50 mm) (panel i) or following treatment with nicardipine (panel ii) and nifedipine (panel iii). *, p < 0.05 versus 10–20 mm KCl/transfection group (i) and KCl/transfection group (ii), †, p < 0.05 versus scrambled group.

