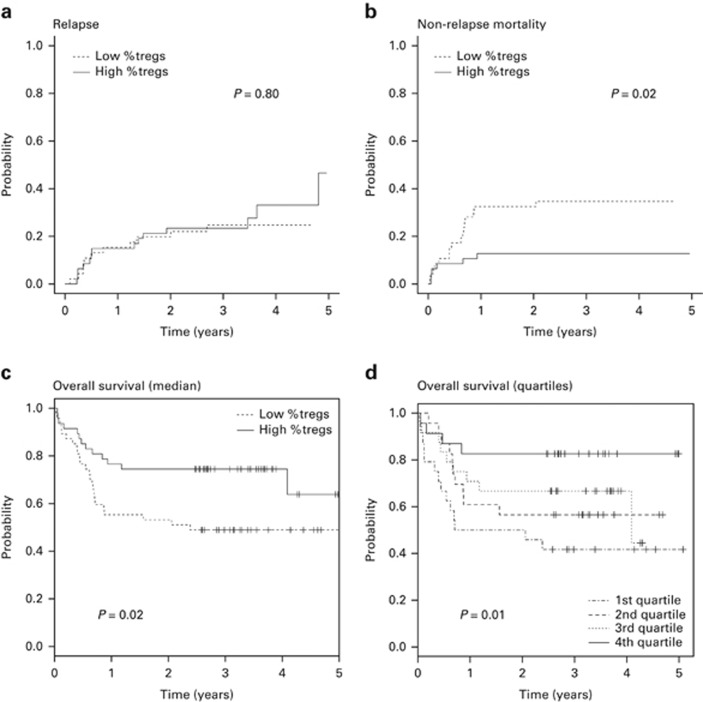
Figure 3.
Relapse, NRM and overall survival. The cumulative incidence of (a) relapse and (b) NRM according to the proportion of Tregs (Tregs/CD4+ T cells) in the graft. (c and d) Overall survival according to the proportion of Tregs (Tregs/CD4+ T cells) in the graft. (c) Low %Tregs, Tregs/CD4+ T cells below the median (dotted line); High %Tregs, Tregs/CD4+ T cells above the median (solid line). (d) 1st Quartile, Tregs/CD4+ T cells <0.022; 2nd quartile, Tregs/CD4+ T cells 0.0223–0.0296; 3rd quartile, Tregs/CD4+ T cells 0.0297–0.0393; 4th quartile, Tregs/CD4+ T cells >0.0394; Tregs, regulatory T cells.

