Figure 2.
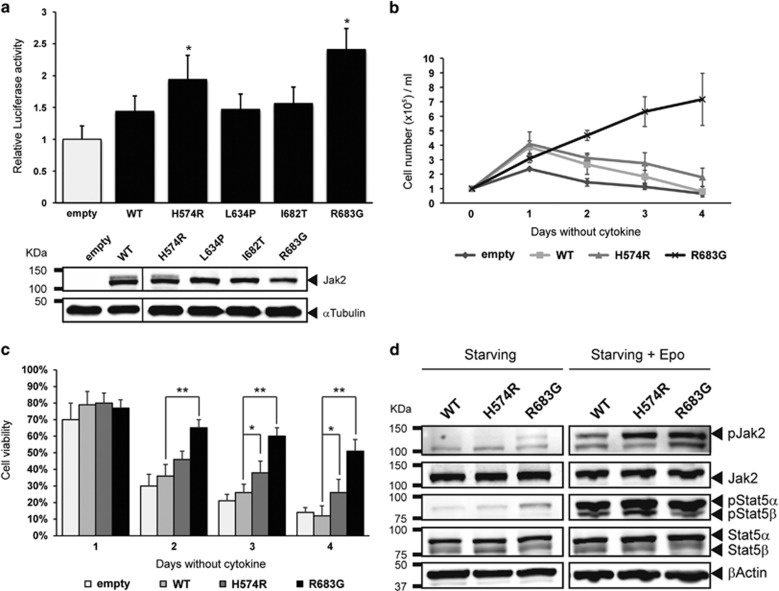
Effects of the JAK2 mutations in inducing JAK/STAT pathway activation and in driving cytokine independence cell proliferation. (a) JAK2-driven STAT5 transcriptional activity, measured by luciferase assay in γ2A cells transiently transfected with wild-type or four different mutant JAK2, or empty vector as a control. A representative western blot of JAK2 can be seen under the bar chart. Error bars represent the standard deviation (s.d.); *P<0.01. (b and c) BaF3-EpoR cells stably expressing WT-JAK2, H574R-JAK2 or R683G-JAK2 were washed and seeded at 1 × 10⁵ cells/ml in medium deprived of Epo. Viable and total cells were counted every 24 h for four consecutive days. (b) A graphical view of cell proliferation for each cell line. Error bars represent the s.d.; *P<0.05 and ** P<0.01. (c) Bar representation of cell viability in percentage, indicating the significance between JAK2 variants within time points. (d) Representative western blot analysis of sorted BaF3-EpoR cells stably expressing WT-JAK2, H574R-JAK2 or R683G-JAK2. Cells were maintained for 24 h in medium without Epo (Starving) and then stimulated or not for 20 min with 1 U/ml of Epo (Starving+Epo). Total levels or phosphorylation of JAK2 and STAT5 were analyzed by incubation with their specific antibodies. Error bars represent the s.d.; *P<0.05 and **P<0.01.

