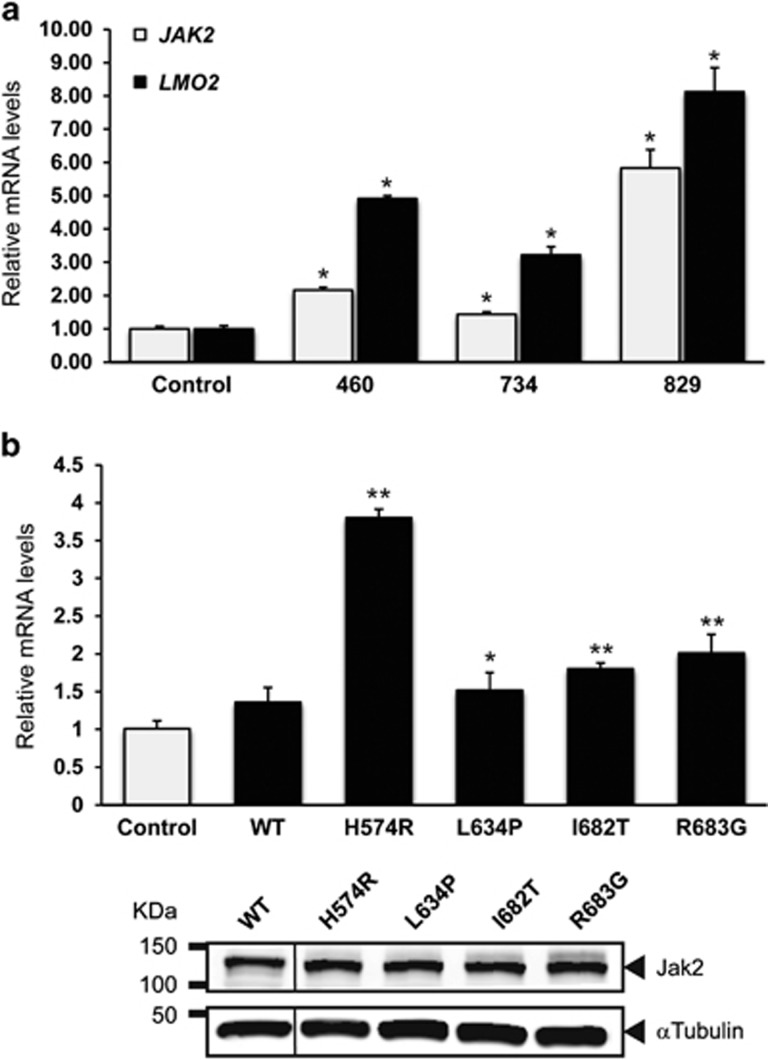
Figure 5.
qRT-PCR analysis of JAK2 and LMO2 expression. (a) The mean mRNA values of JAK2 and LMO2 in T-LBLs harboring JAK2 genetic alterations were normalized to those of a pool of fetal thymuses. Data represent three independent replicates. Error bars represent the s.d.; *P<0.01. A representative western blot of JAK2 can be seen under the bar chart. (b) The mean mRNA values of LMO2 in γ2A cells transiently transfected with mutant JAK2 variants were normalized to that of wild-type JAK2-expressing cells. Data represent three independent replicates. Error bars represent the s.d.; *P<0.05 and **P<0.01.

