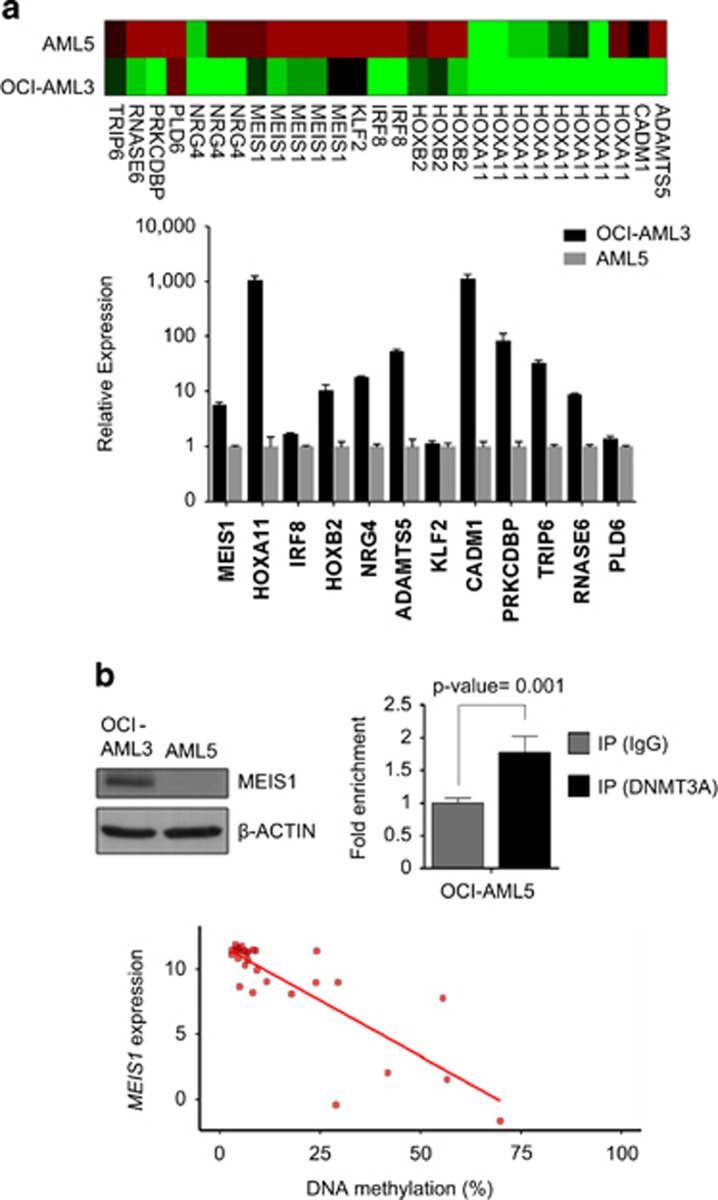
Figure 3.
DNMT3A mutations in AML are associated with a DNA hypomethylation signature characterized by MEIS1 induction. (a) DNA methylation level of the 28 CpG sites among the 12 candidate genes in the OCI-AML3 and AML5 cell lines analyzed by DNA methylation array (upper panel). Relative gene expression levels of the 12 genes related to DNMT3A mutation profiled by quantitative PCR in OCI-AML3 (black) and AML5 (gray) cell lines (lower panel). (b) Protein levels of MEIS1 in OCI-AML3 and AML5 cells analyzed by immunoblotting (top left panel). Quantitative chromatin immunoprecipitation assay to assess DNMT3A occupancy at the MEIS1 studied CpG sites in AML5 cells. Data are presented as fold enrichment±s.e.m. Data of four independent experiments are shown. Significance of Student's t-tests is shown. IgG, immunoglobulin G (top right panel). Standard deviations are indicated by error bars. Bottom panel, association between the DNMT3A mutation-related differentially methylated CpG sites in MEIS1 and transcriptional activity using matched data from 170 primary AML samples (Cancer Genome Atlas Research Network2). Mean DNA methylation levels over the five CpG sites of MEIS1 and gene expression levels in DNMT3A mutant patients are shown.

