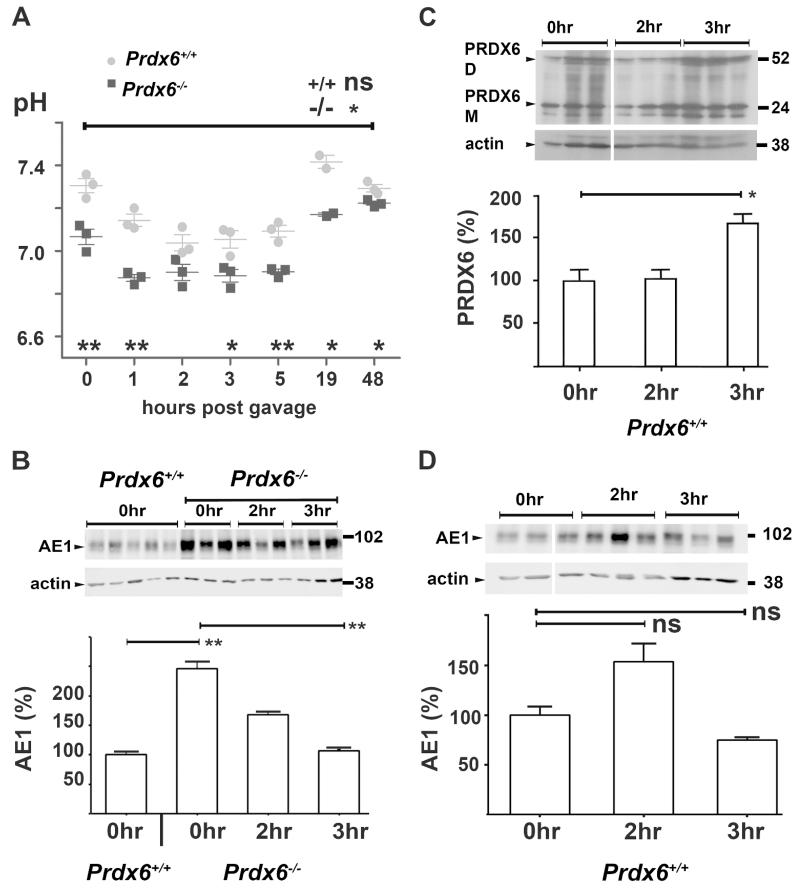
Figure 3. PRDX6 and kAE1 expression studies in acidified Prdx6+/+ and Prdx6−/− mice.
(A) pH of terminally collected whole-blood from Prdx6+/+ (grey circles) and Prdx6−/− (black squares) animals at time points after acid gavage. (B) Baseline kAE1 expression (normalized to actin and relative to WT as 100% at t=0hr) is significantly greater in Prdx6−/− animals compared to Prdx6+/+ animals and at 3hrs post gavage, Prdx6−/− animals have significantly decreased expression. (C) PRDX6 expression (combined monomer and dimer normalized to actin relative to t=0hr) is maximally increased in Prdx6+/+ animals 3 hr post gavage. (D) kAE1 expression in Prdx6+/+ animals is not significantly changed. (all time points refer to hours post gavage, error bars represent ± standard error, * = p<0.05, ** = p<0.01)

