Figure 1.
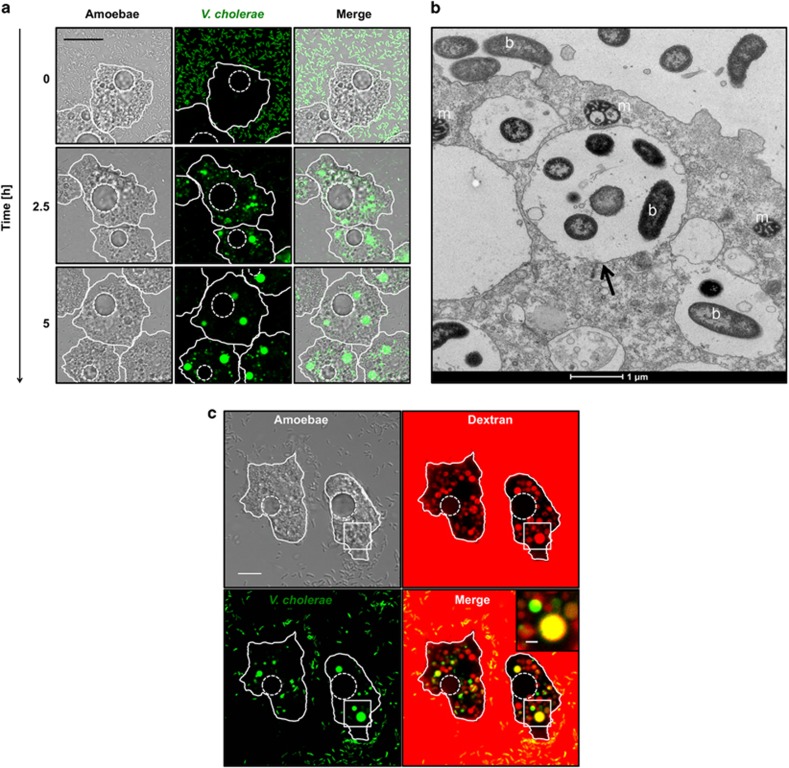
Uptake of V. cholerae by A. castellanii. (a) Time-lapse confocal microscopy imaging experiment to monitor the interaction of A. castellanii and V. cholerae. The amoebae are visible in the transmitted-light channel (labeled Amoebae) and the GFP-producing bacteria in the green channel (labeled V. cholerae). The merged signals are shown on the right (labeled Merge). The time p.p.c. is indicated on the left (in h). Amoebae are delineated by solid white lines, whereas the CVs are marked by dashed white lines (valid for all figures). Scale bar: 20 μm. See also Supplementary Movie S1. (b) Representative transmission electron micrograph showing undigested bacteria (b) surrounded by a vacuolar membrane (black arrow) compared with cytosolic mitochondria (m) at 3 h p.p.c. (c) Undigested V. cholerae localize to food vacuoles. Colocalization of GFP-producing bacteria (labeled V. cholerae) and Alexa Fluor 647-conjugated dextran (labeled Dextran) within vacuolar compartments of A. castellanii at 3 h p.p.c. (amoebal structures are visible in the transmission-light channel; labeled Amoebae). A merged image of the two fluorescent channels is also depicted (labeled Merge). Scale bar: 10 μm. The inset shows a magnification of the white-boxed area in the merged image (scale bar: 2 μm).

