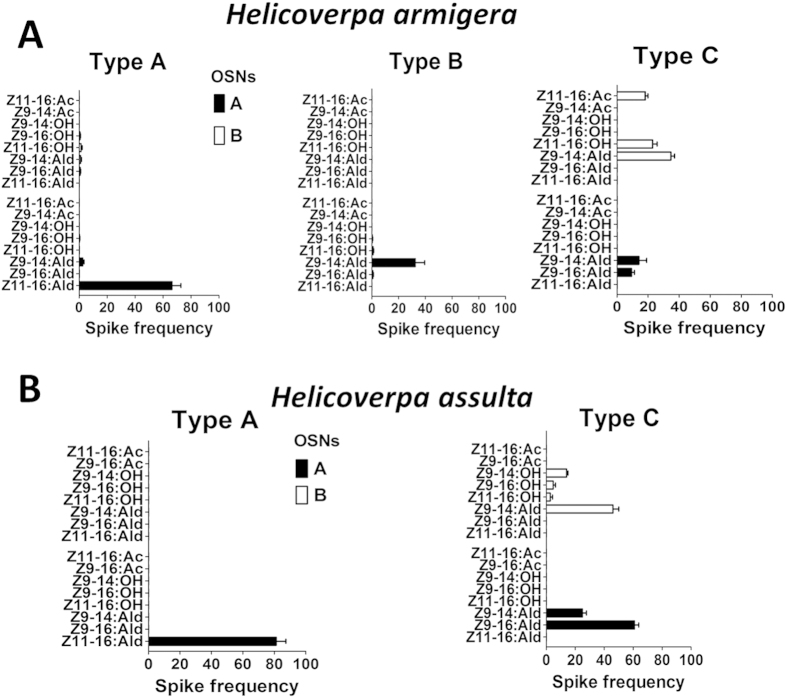
Figure 3. Response profiles of two distinct OSNs (A,B) housed together in different types of sensilla on the antenna of male H. armigera (A) and H. assulta (B) to 1 mg stimuli.
The response value (Spike frequency) was calculated as the difference in spike number recorded 1 s before and 1 s after the stimulus delivery. Error bars indicate SEM (n = 7–13).

