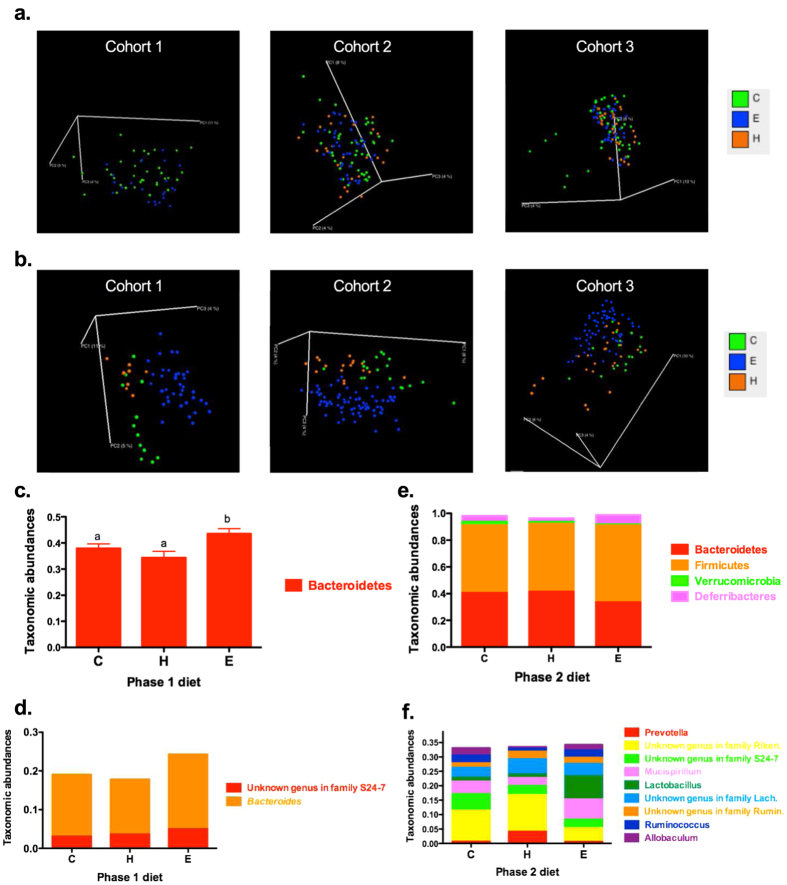
Figure 3. Colonic microbiota differs by diet.
Diet interventions in phase 1 and phase 2 affected the microbiota structure in each individual cohort at the end of the study (60 weeks), showed in PCoA figures (a,b, respectively, not controlled for colonic sites). Each point corresponded to a sample colored by diet ( : CON,
  : HF, and
  : ER). Phase 1 diet significantly changed the relative abundances of one phylum (c) and two genera (d), while phase 2 diet significantly affected the relative abundances of four phyla (e) and nine genera (f). Different letters in the bar chart indicate significant different, p < 0.05.

