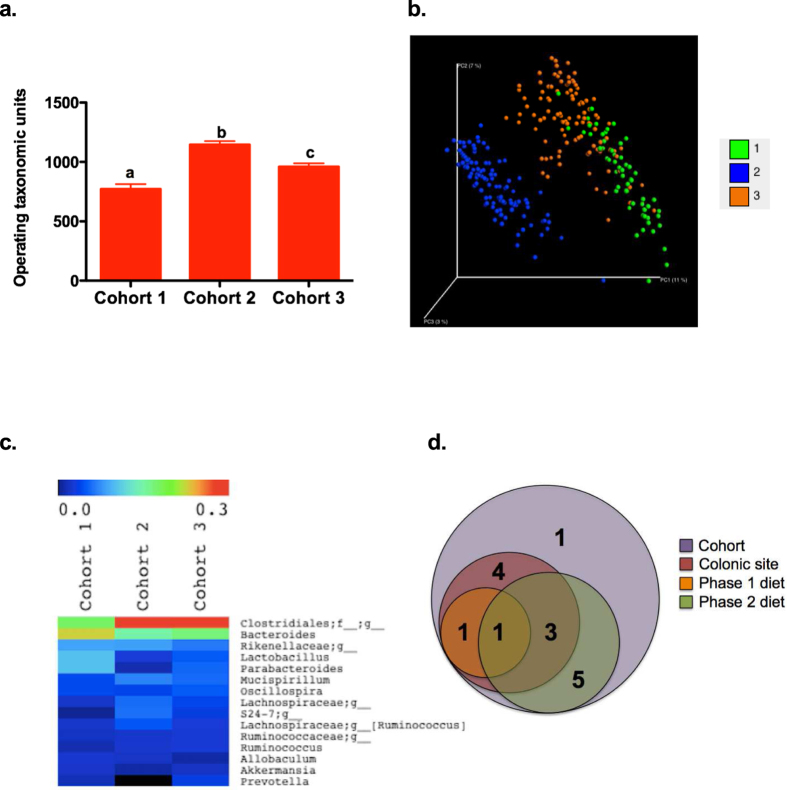
Figure 5. Microbiota differs by cohorts.
OTU numbers of the colonic microbiota were significantly changed by cohorts, different letters indicate significant different, p < 0.05 (a). Variation in community diversity by cohort was shown in a PCoA figure (b). Each point represented a sample colored by cohort ( : cohort 1;
  : cohort 2;
  : cohort 3). The significantly changed relative abundances of 15 genera by cohorts were shown in the heat map (c). Numbers in the Venn represented the number of genus significantly changed by phase 1 diet, phase 2 diet, anatomical locations in colon, and cohorts (d). Numbers in the overlapped area represented the number of same genus modified by multiple factors independently. OTU: Operational taxonomic units.

