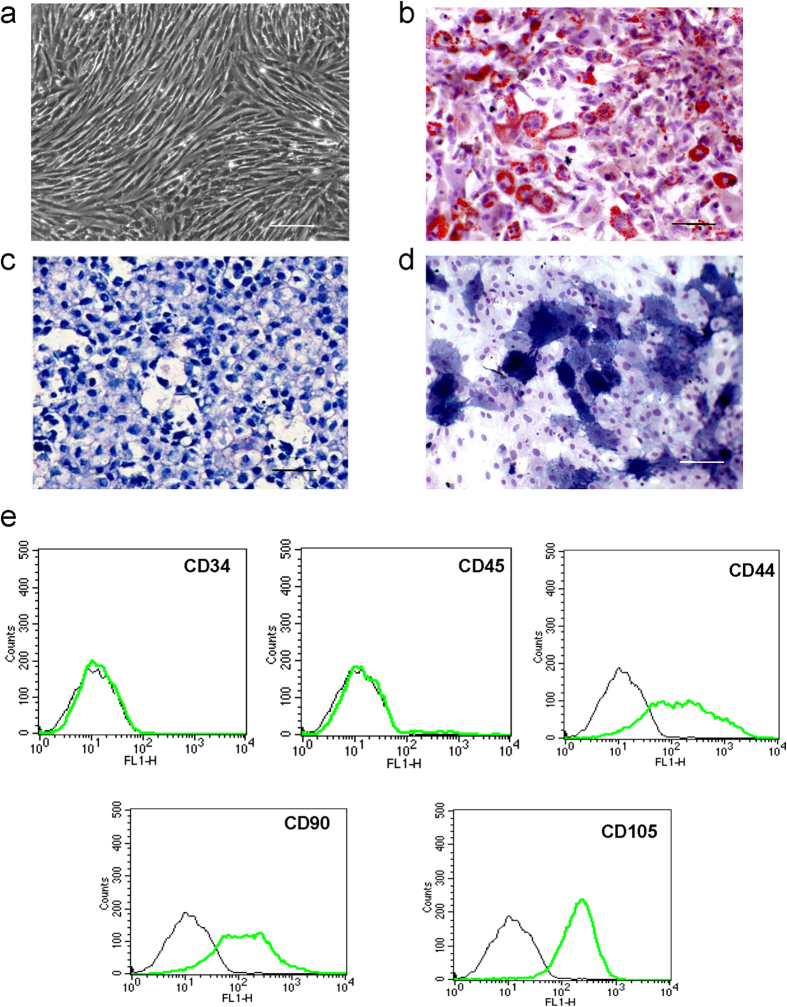
Figure 1. Identification of ADSCs by multi-lineage differentiation and cell surface markers.
(a) Passage 3 ADSCs show fibroblast-like morphology (original magnification 100×). (b) Oil red stain shows lipid droplets 1 week after the induction of adipogenic differentiation. (c) ADSCs pellets were stained positively with toluidine blue after induction of chondrogenic differentiation at 14 days. (d) Alkaline phosphatase was detected in the cytoplasm 14 days after induction of osteogenic differentiation. The scale bar is 100 μm. (e) Specific cell surface markers were detected by flow cytometry. The ADSCs were negative for the hematopoietic lineage markers CD34 and CD45. The fractions of CD44-, CD90-, and CD105-positive cells were 67.63%, 68.13% and 92.43%, respectively, indicating their mesenchymal origin. The experiments were performed three times, and representative images are shown. Values are the mean ± SEM.

