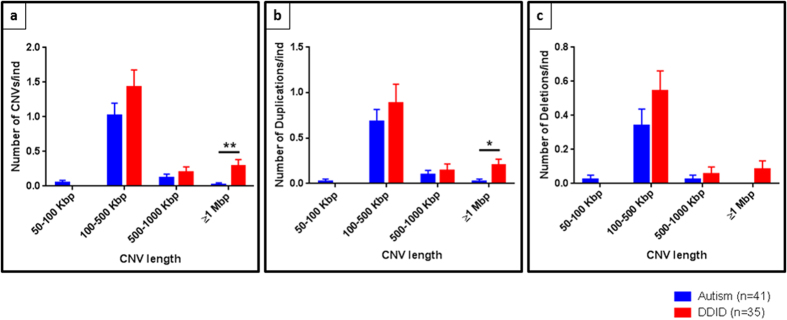
Figure 4. Size distribution of CNVs in autism patients (in blue) versus the Developmentally Delayed/intellectually disabled (DD/ID) group (in red).
Data are means ± SD. (a) The DD/ID group have more CNVs per individual than autism patients except for CNVs that are smaller than 100Kbp. The trend is similar when we look at (b) duplications and (c) deletions (**p value = 0.0082 ; *p value = 0.00209; Mann-Whitney test).

