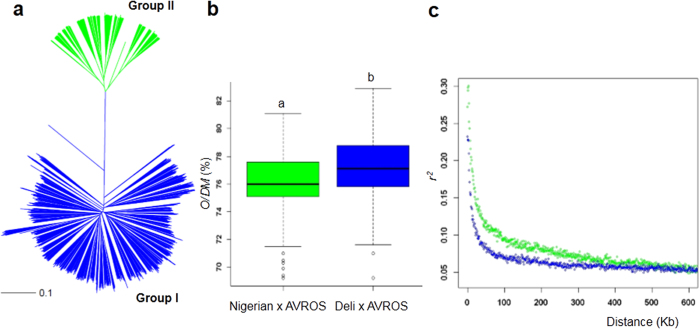
Figure 1. Genetic stratification of 2,045 oil palm samples representing Deli x AVROS and Nigerian x AVROS.
(a) Neighbor-joining tree (NJ) constructed from Hamming distances for all SNPs. The two divergent groups, Group I and Group II are shown in blue and green, respectively. The scale bar indicates the Hamming distance. (b) The boxplots represent median values, percentile 25–75 and outliers for the oil-to-dry mesocarp (O/DM) of the two divergent groups (color as in a). Statistical significance for each group was determined by a Student-t test at p < 0.001. (c) Genome-wide average LD decay rate estimated from 1,459 Deli x AVROS (Group I) and 586 Nigerian x AVROS (Group II) palms (color as in a).

