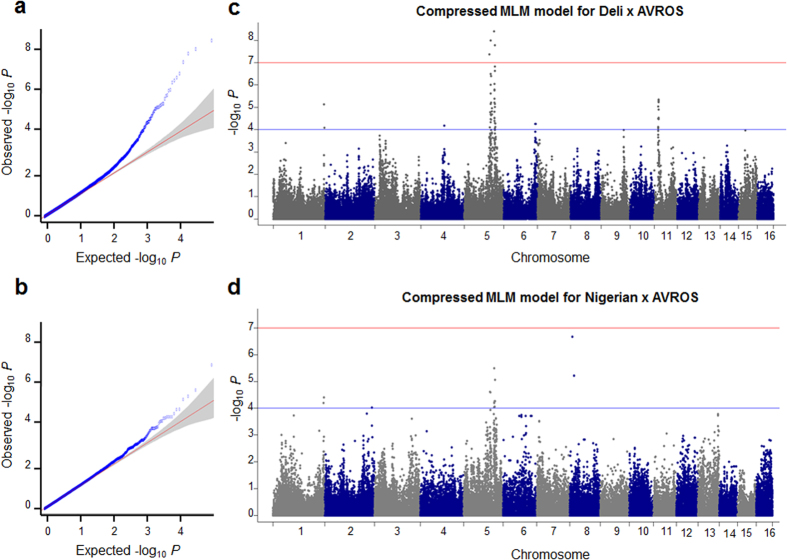
Figure 2. Genome-wide association studies results for oil-to-dry mesocarp (O/DM).
(a) Quantile-Quantile plot of compressed MLM for Deli x AVROS. (b) Quantile-Quantile plot of compressed MLM for Nigerian x AVROS. (c) Manhattan plots of Compressed MLM model for Deli x AVROS. Negative log10-transformed p values from a genome-wide scan are plotted against position on each of the 16 chromosomes. The blue and red horizontal lines indicates the genome-wide significance cut-off and Bonferroni cut-off. (d) Manhattan plots of Compressed MLM model for Deli x AVROS, as in (c).

