
Figure 5.
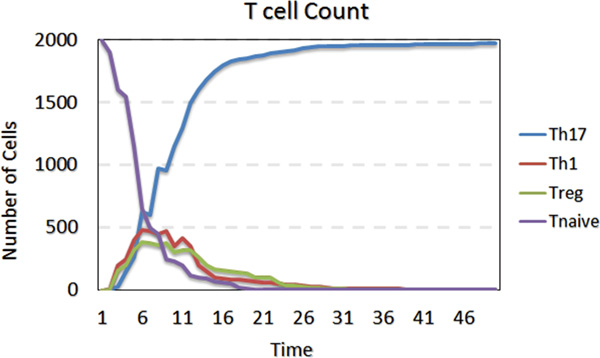
T Cell counts in subtypes. Simulation performed using the RM scenario. The X-axis is the simulation time in cycles and the Y-axis is the numbers of different T Cell subtypes. This figure shows the dynamics of T cell subtypes during the simulations.