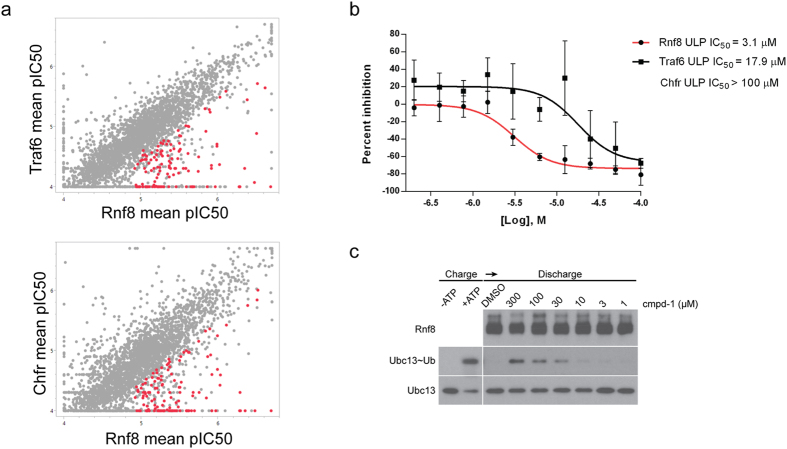
Figure 4. ULP method reveals a subset of Rnf8 selective compounds.
(a) Mean pIC50 values of 3,327 hits compared between Rnf8 and Traf6 assays (upper panel) and between Rnf8 and Chfr assays (lower panel) (n = 3). A subset of 127 hits with Rnf8 ULP pIC50 ≥ 4.9 and ≥0.5 log unit selectivity in Rnf8 versus both Traf6 and Chfr assays is highlighted as red dots in both plots. (b) Concentration-dependent response of compound-1 in Rnf8, Traf6 and Chfr ULP assays using a concentration range from 0.2–100 μM in two-fold dilution steps (n = 5). Note that compound-1 does not demonstrate Chfr assay inhibition within the tested concentration range (data not shown), and therefore Chfr ULP IC50 is indicated as >100 μM. (c) Concentration-dependent block of Ubc13~Ub thioester discharge by compound-1 (cmpd-1).

