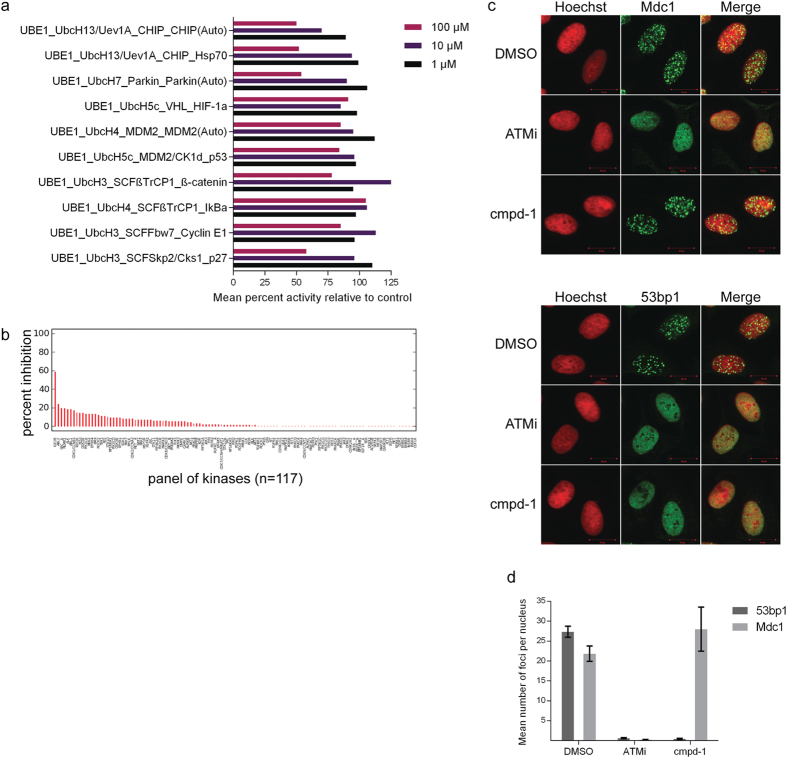
Figure 5. Inhibition of Rnf8-driven signalling by compound-1.
(a) Mean percent inhibition data (n = 2) for compound-1 across a panel of 10 indicated ubiquitylation cascades at 1, 10 and 100 μM concentration. (b) Percent inhibition data for compound-1 across a panel of 117 kinases. Single-shot data was generated for a concentration of 1 μM of compound. Negative values have been truncated to zero in the plots. (c) Confocal microscopy of U-2 OS cells pre-incubated with either DMSO, Atm inhibitor (12.5 μM) or compound-1 (50 μM) prior to irradiation with 10 Gy. Repair foci visualized by immunofluorescence with Mdc1 (upper panel) or 53bp1 (lower panel) antibodies and Hoechst for nuclear staining. (d) Quantification of data displayed in (c).

