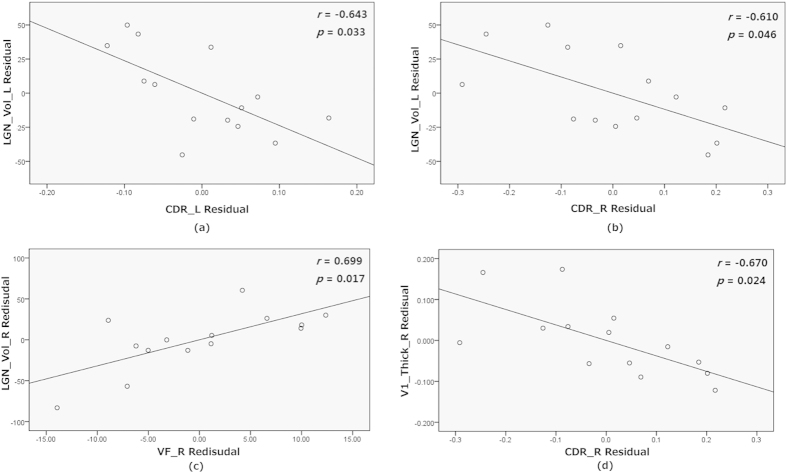
Figure 4. The partial correlation between the corresponding value of abnormal regions and clinical parameters with age, gender and intracerebral volume as covariates.
LGN_Vol_L/R: left/right LGN volume, V1_Thick_R: right V1 cortical thickness, CDR_L/R: left/right cup to disk ratio, VF_R: right visual field mean deviation. M Residue: the difference between M (the observed value) and the result (the theoretical value) of linear regression of M with age, gender and intracerebral volume.

