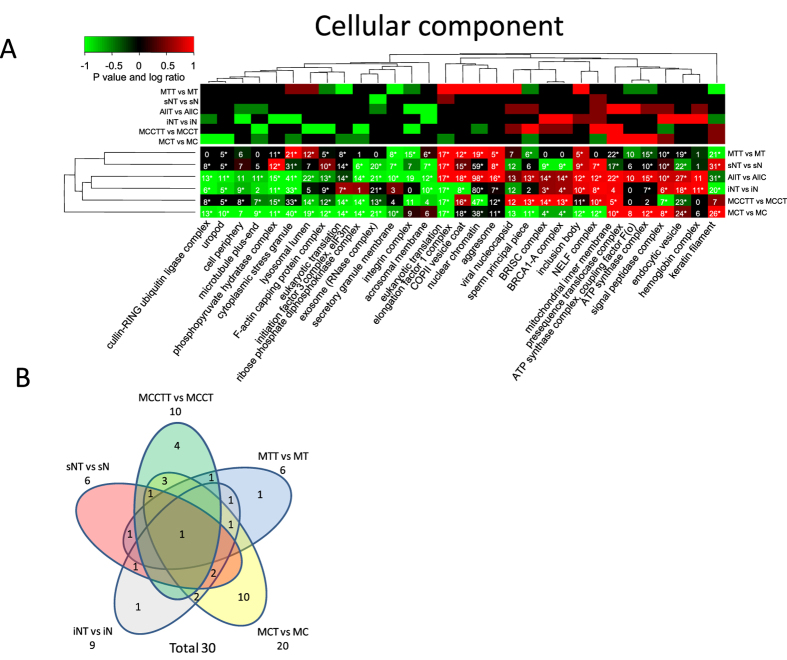
Figure 4. Functional regulation analysis filtered for minimum 10 proteins per category.
(A) The lower heatmap panel indicates significant up- or down- regulated cellular component from gene ontology categories. P values are log ratio encoded (see methods sections for details). The upper panel indicates the log ratios where color code for log ratio 1 indicates a log ratio > = 1 and for −1 indicates log ratio < = −1. The numbers in each cell indicate the maximum number of proteins identified across all replicas for a specific protein category and subcellular fraction.*) indicates that the functional enrichment analysis is significant (P value <0.05 after FDR correction for multiple testing). (B) Venn diagram of the overlap of significant regulated cellular component categories. Overlaps with no numbers indicate zero overlap.

