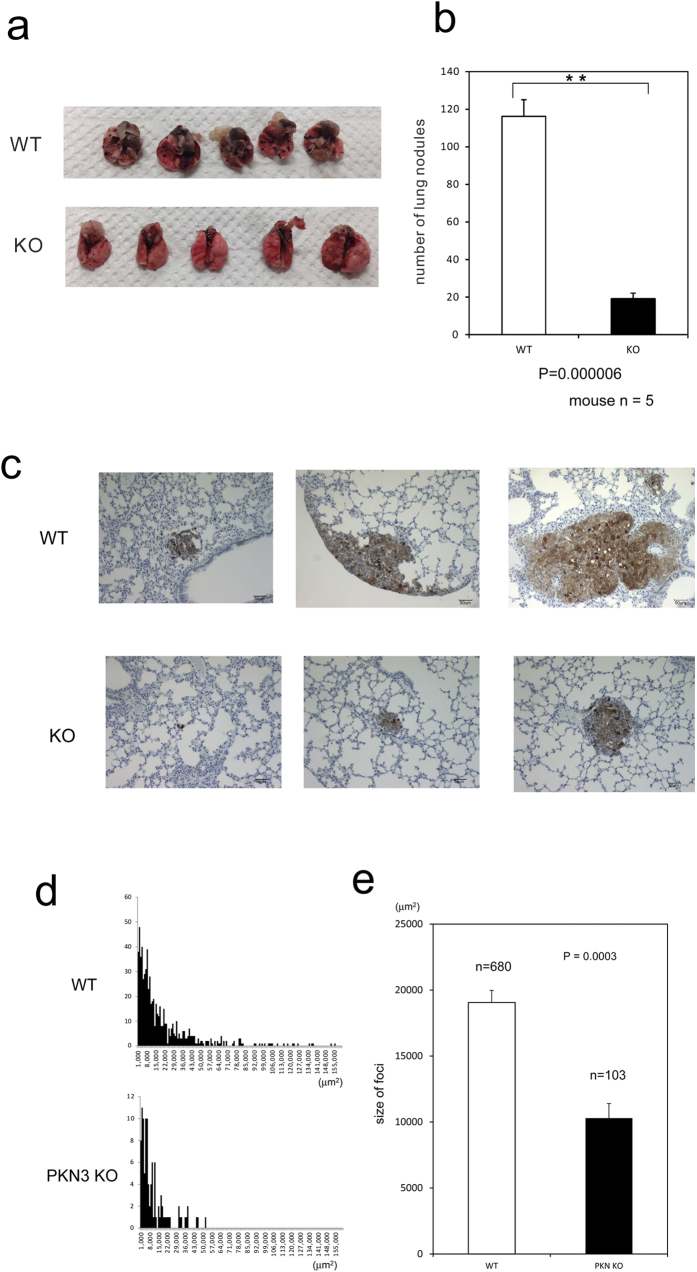
Figure 6. Reduced metastasis formation in PKN3 KO mice.
(a) Macroscopic appearance of lungs obtained from WT and PKN3 KO mice at 14 days after an i.v. injection of B16BL6 cells. (b) The number of metastatic foci on the lung surface. ** indicates P < 0.01. (c) Microscopic appearance of lungs after B16BL6 cell injection. Lungs were removed at 14 days after injection of melanoma cells, and processed to anti S100 antibody staining to visualize melanoma cells and H&E staining. Representative results from independent mice are shown here. (d) The tumor size histogram of metastatic foci. The horizontal axis indicates the size of tumor (μm2) observed in the slice section of mouse lungs. The vertical axis indicate the number of foci. (e) The average size of foci of mouse lungs.

