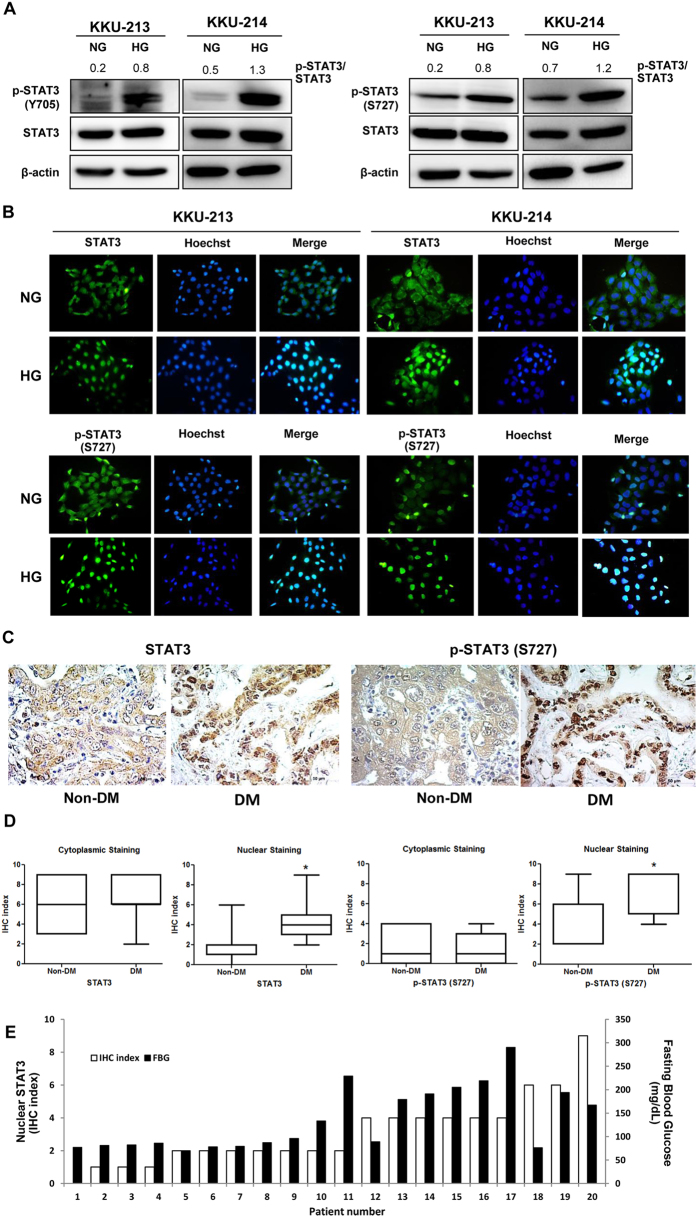
Figure 4. High glucose promotes phosphorylation and nuclear translocation of STAT3.
Activation of STAT3 was verified in HG cells vs. NG cells of KKU-213 and KKU-214. (A) p-STAT3 of Y705 and S727 were determined using western blotting. β-Actin was used as an internal control and the numbers indicate the p-STAT3/STAT3 ratio. (B) Nuclear localization of STAT3 and p-STAT3 (S727) was demonstrated using immunocytofluorescent staining. Hoechst staining (blue) indicates nucleus; STAT3 and p-STAT3 conjugated FITC (green) indicate cytoplasmic or nuclear localization of STAT3 and p-STAT3; and the merged image (bright blue) indicates co-localization of STAT3 and p-STAT3 with Hoechst. (C) The immunohistochemistry of STAT3 and p-STAT3 in CCA patient tissues with DM (≥126 mg/dL; n = 9) and no DM (<126 mg/dL; n = 11) indicates significantly higher nuclear localization of STAT3 and p-STAT3 (S727) of tissues from CCA patients with DM than those without DM. (D) The quantification of immunohistochemistry of STAT3 and p-STAT3. (E) The immunohistochemistry index (IHC) of nuclear STAT3 in CCA tissues were correlated with the levels of fasting blood sugars of individual patients (Spearman’s Rho = 0.896, P < 0.01). NG and HG = cells continuously cultured in normal and high glucose media; *P < 0.05.

