
Fig. 1.
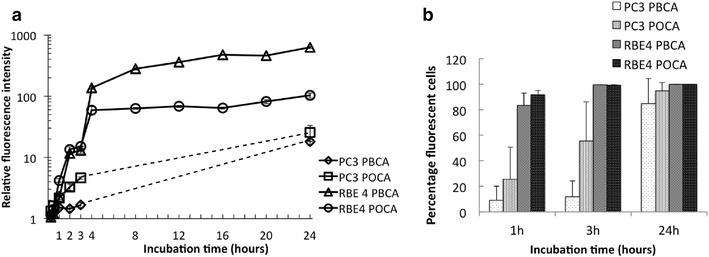
a PBCA and POCA NP uptake kinetics in PC3 and RBE4 cells expressed as fluorescence intensity relative to untreated cells on a logarithmic scale. b Percentage of NP-positive cells. n = 2, error bars are SD, partly within the symbols
Official websites use .gov
A
.gov website belongs to an official
government organization in the United States.
Secure .gov websites use HTTPS
A lock (
) or https:// means you've safely
connected to the .gov website. Share sensitive
information only on official, secure websites.
a PBCA and POCA NP uptake kinetics in PC3 and RBE4 cells expressed as fluorescence intensity relative to untreated cells on a logarithmic scale. b Percentage of NP-positive cells. n = 2, error bars are SD, partly within the symbols