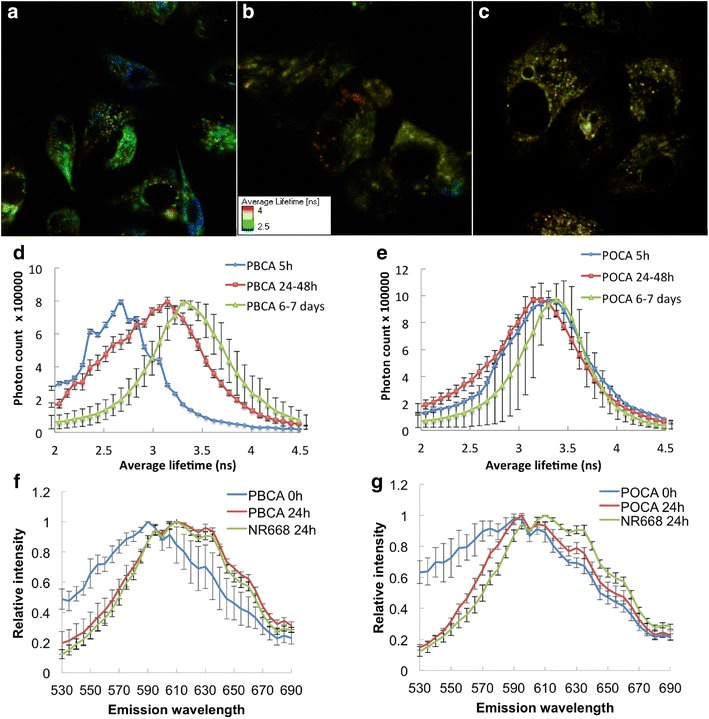
Fig. 7.

a–c FLIM images of PC3 cells incubated for 24 h with free NR668 (a), PBCA (b) and POCA NPs (c) before growing for additional 5 days. Each pixel is colored based on the average lifetime. Fluorescence lifetime distribution for PBCA (D) and POCA (E) NPs inside cells at 5, 24–48 and 144–168 h (6–7 days). Emission spectra from PC3 cells incubated with free NR688 (green) or PBCA (f) or POCA NPs (g) after 24 h (red), or the NPs prior to incubation (blue). n = 5, error bars give SD
