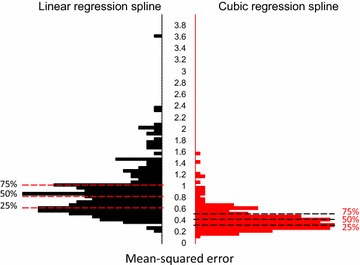
Fig. 4.

Subject-specific distributions of the square root MSEs for the entire growth curve for linear splines (black) versus cubic splines (red). Dashed lines correspond to the estimated median, 25 %, and 75 % percentiles of the subject-specific MSE distribution. Cubic regression splines outperformed piecewise linear splines: the median square root subject-specific MSE for linear regression splines was 0.65 vs. 0.51 for cubic regression splines. The Kolmogorov–Smirnov test indicates that the two distributions are significantly different (D = 0.19, p = 0.001)
