Figure 6.
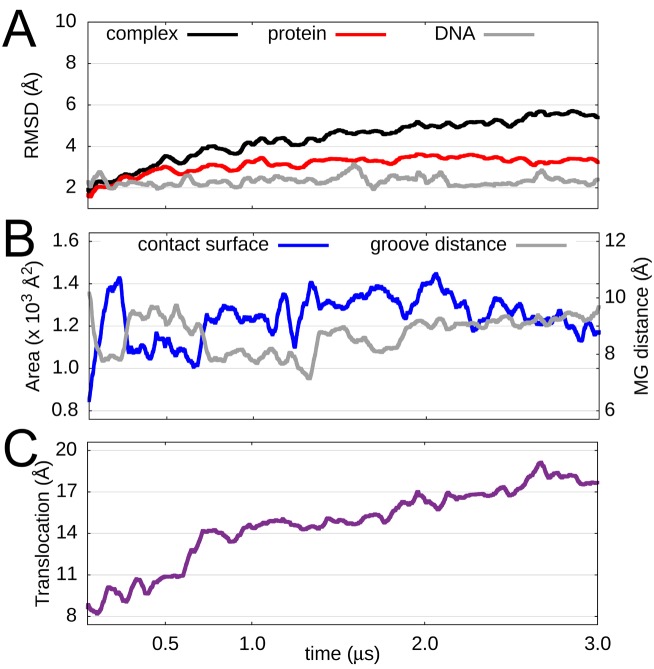
MTERF1 in search mode. (A) Structural stability of the search mode complex as measured by the backbone RMSD of the DNA (grey), MTERF1 (red) and the MTERF1-DNA complex (black), the last two of which were aligned to the protein; all used the structure at 20 ns as the reference, to account for docked pose relaxation. While the protein RMSD remains stable, that of the complex steadily rises. (B) Time dependence of the contact surface area shared by MTERF1 and the DNA (blue) and the major groove distance (grey). (C) Distance between the centres-of-mass of protein and DNA; increasing values with time suggest change in the location of the protein on the DNA. Data shown are averaged with a 50 ns sliding window.

