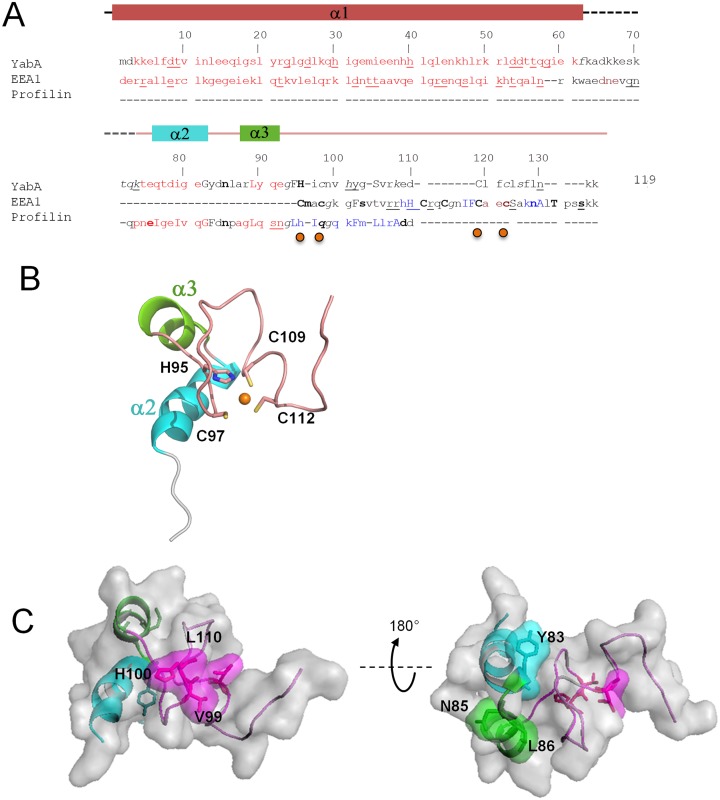
Figure 3.
Homology model of the YabA-CTD monomer. (A) Structural sequence alignment of YabA model with the identified homologs EEA1 (pdb code 1JOC) (46) and profilin (1YPR) using the Joy algorithm(63), highlighting the structural similarities between YabA model and it's templates. Alpha helix (red); 310 helix (maroon); beta strand (blue); solvent accessible residues (lower case); solvent inaccessible residues (upper case); hydrogen to bond main-chain amide(bold), hydrogen bond to main-chain carbonyl (underline). Secondary structures of YabA are indicated on top and correspond to the crystal structure (residues 1–62) and the homology model (76–119). The residues involved in Zn coordination are indicated by orange dots. (B) Cartoon representation of YabA CTD model colored as in (A). Side chains of the residues participating in Zn binding are indicated as ball and sticks. (C) Surface representation of YabA-CTD revealing surface-exposed residues important for interaction with DnaN (left) and DnaA (right) identified in a previous study (15).

