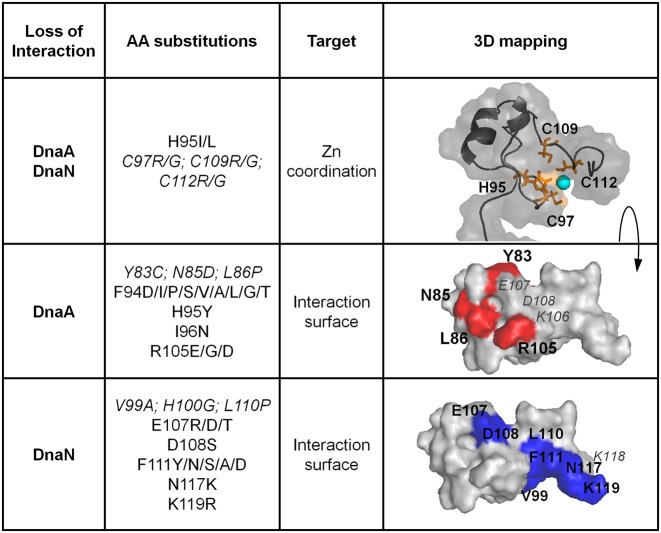
Figure 5.
Surface representation of YabA showing key residues involved in interactions with partner proteins. Mapping of mutational data onto the structural model with interacting surfaces specified by color; DnaA (Blue) DnaN (red). Previous data is indicated in italic. Zn is illustrated by a cyan sphere. Residues with no interacting phenotypes are labeled in gray.

