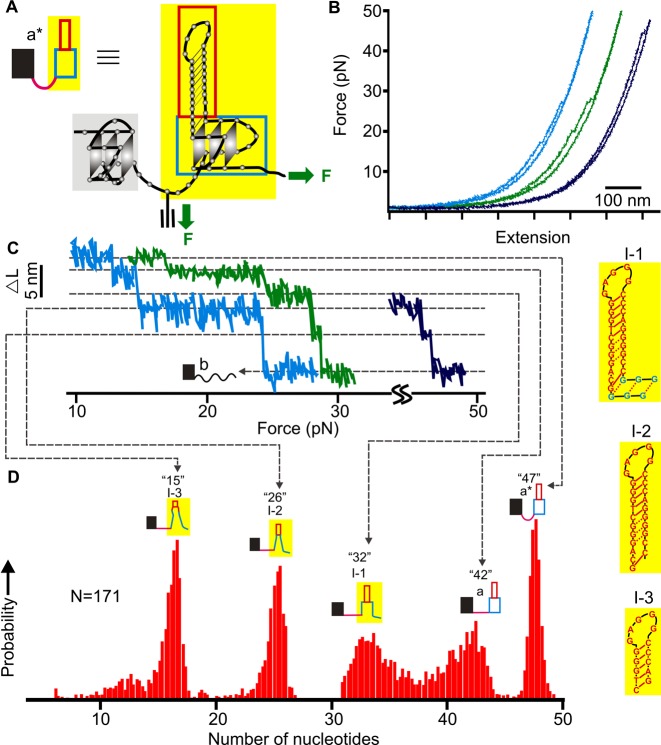
Figure 2.
Mechanical unfolding of the NMS5–12 construct. (A) Schematic drawing of the native mechanical segmentation strategy. The green arrows depict attachments of two DNA handles that determine the direction of unfolding. (B) Representative F-X curves with different unfolding events from the same molecule. (C) Plot of change-in-contour-length (ΔL) versus force. Each plot was derived from a corresponding curve in B (see Supporting Information for details). (D) Probability of different populations identified from the PoDNano analysis (see Supporting Information). The number of nucleotides for each species is depicted on top of each structure diagram. Possible structures of three main intermediates are shown to the right. Solid and dotted red lines indicate Watson–Crick and Hoogsteen base pairings, respectively. See Supplementary Figures S6 and S7 for possible structures of all species.

