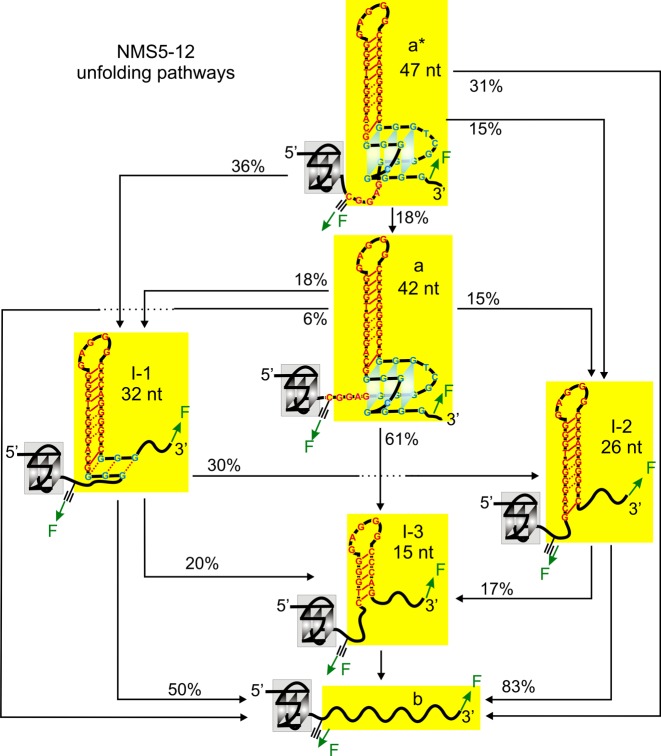
Figure 3.
Unfolding pathways of the NMS5–12 construct based on the unfolding events observed in Figure 2. See Supplementary Figures S6 and S7 for detailed structures of each species. See Supplementary Table S2 for the number of molecules and traces used in the analyses. In each folded structure, solid and dotted red lines indicate Watson–Crick and Hoogsteen base pairings, respectively.

