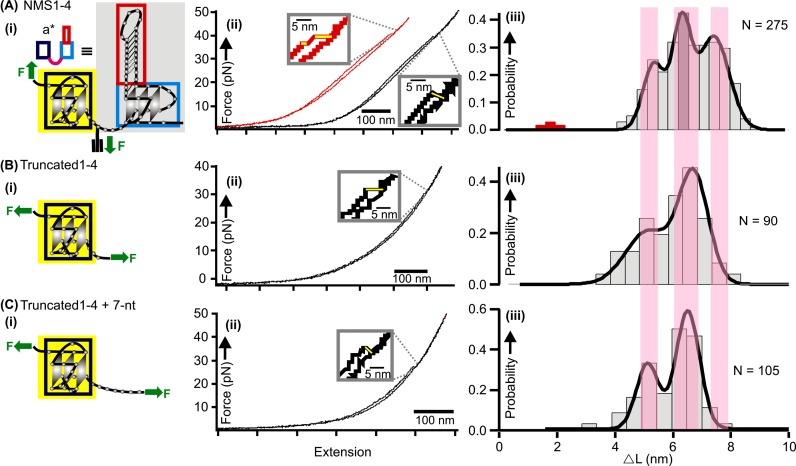
Figure 4.
Mechanical unfolding of the NMS1–4 construct (A) and truncated1–4 constructs (B and C). (i) Schematic diagram of the mechanical unfolding for each construct. The green arrows depict the attachment of DNA handles that determine the direction of unfolding. (ii) Typical F-X traces observed for different constructs. (iii) ΔL histograms of the unfolding transitions observed in respective constructs. Notice the ≈1.2 nm population (red) in (A-iii) corresponds to the first unfolding feature in the red trace of (A-ii). See Supplementary Table S2 for the number of molecules and traces used in the analyses.

