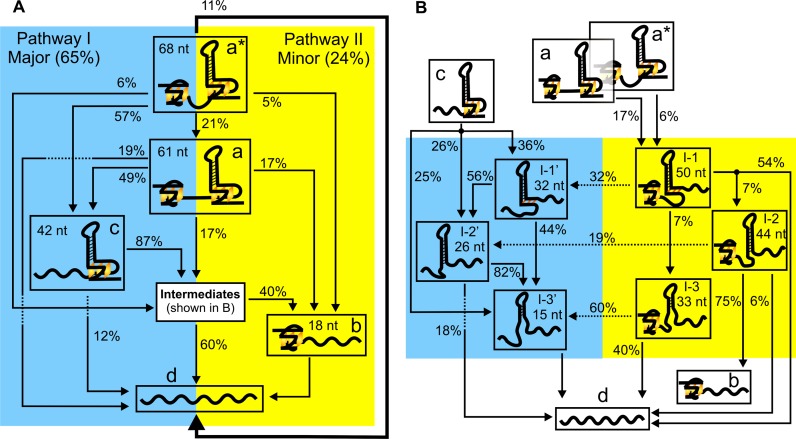
Figure 6.
Unfolding pathways of the hTERT1–12 construct based on the unfolding events observed in Figure 5. (A) Schematic drawing of the unfolding through the 5′-end G-quadruplex (65%, blue) or the 3′-end G-quadruplex (24%, yellow). (B) Unfolding pathways involving various intermediates. See Supplementary Table S2 for the number of molecules and traces used in the analyses.

