Figure 6.
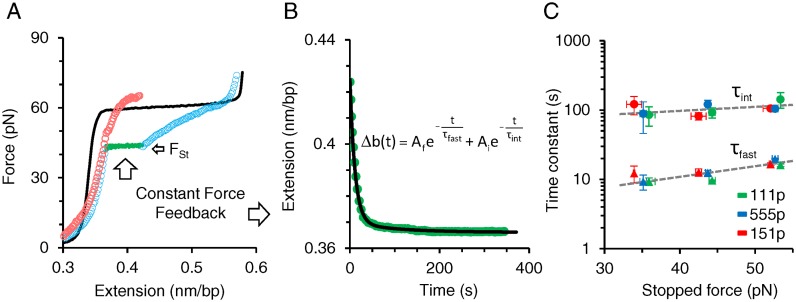
Direct single molecule measurements of fast and intermediate dissociation time constants. (A) Representative data for measuring protein dissociation at constant force. Overstretched dsDNA (solid black) is incubated in 2 nM 111p for 360 s. The returning 111p–DNA complex after incubation (open blue circles) is stopped and maintained at a constant force of 43 pN via a force feedback loop for 360 s. (B) The change in extension with time during the constant force feedback loop (green circles) is fit to a double exponential function of time (solid black). Two time constants τint and τfast represent the characteristic dissociation time constants of the ssDNA-bound 111p populations exhibiting respectively intermediate and fast dissociation kinetics. (C) Variation of the time constants with stopped force for ORF1p variants. Intermediate (circles) and fast (triangles) dissociation time constants are measured as a function of a stopped force (Fst). Green, blue and red data points correspond to: 111p, 555p and 151p respectively. Overall variant averages are fit to an exponential function of force, τ(F) = τ0eF/Ω, using the minimization of χ2 method (dashed gray lines), where Ω is a factor that describes the scale of time constant variation with force. Corresponding fits for τf and τi yield τ0,fast = 2.7 ± 0.4 s, Ωfast = 28 ± 1 pN and τ0,int = 57 ± 4 s, Ωint = 75 ± 10 pN respectively. Error bars are standard errors for at least three measurements (also see Supplementary Figure S4 and Table S3).

