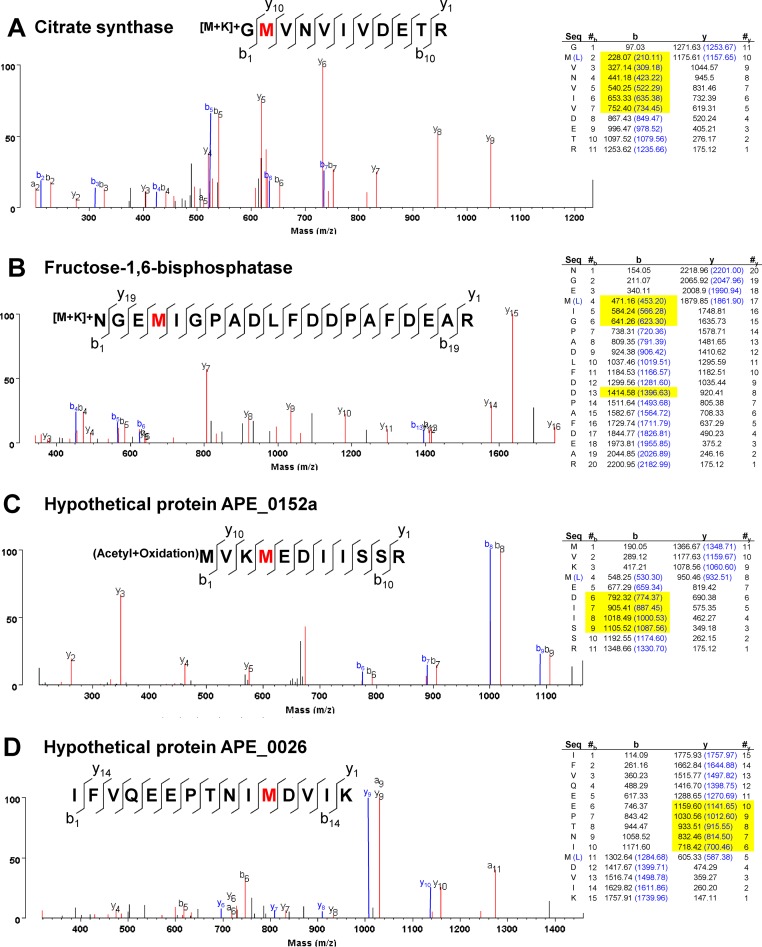
Figure 3.
Mistranslated A. pernix proteins. Total protein mass spectrometry spectra with corresponding ion fragmentation tables from A. pernix grown at 75°C showing Leu-to-Met substitutions in red for citrate synthase (A), fructose-1,6-bisphosphate (B), hypothetical protein APE0152a (C) and hypothetical proteinAPE_0026 (D). Blue peaks in the spectra and blue masses in the ion fragmentation tables show the theoretical data for the genome-encoded, wild-type peptide sequence. The 18Da mass shift associated with Leu-to-Met substitution is illustrated in the differences between the corresponding experimental and theoretical peaks. The identifiable mass shifted peaks are highlighted in yellow.

