Figure 1.
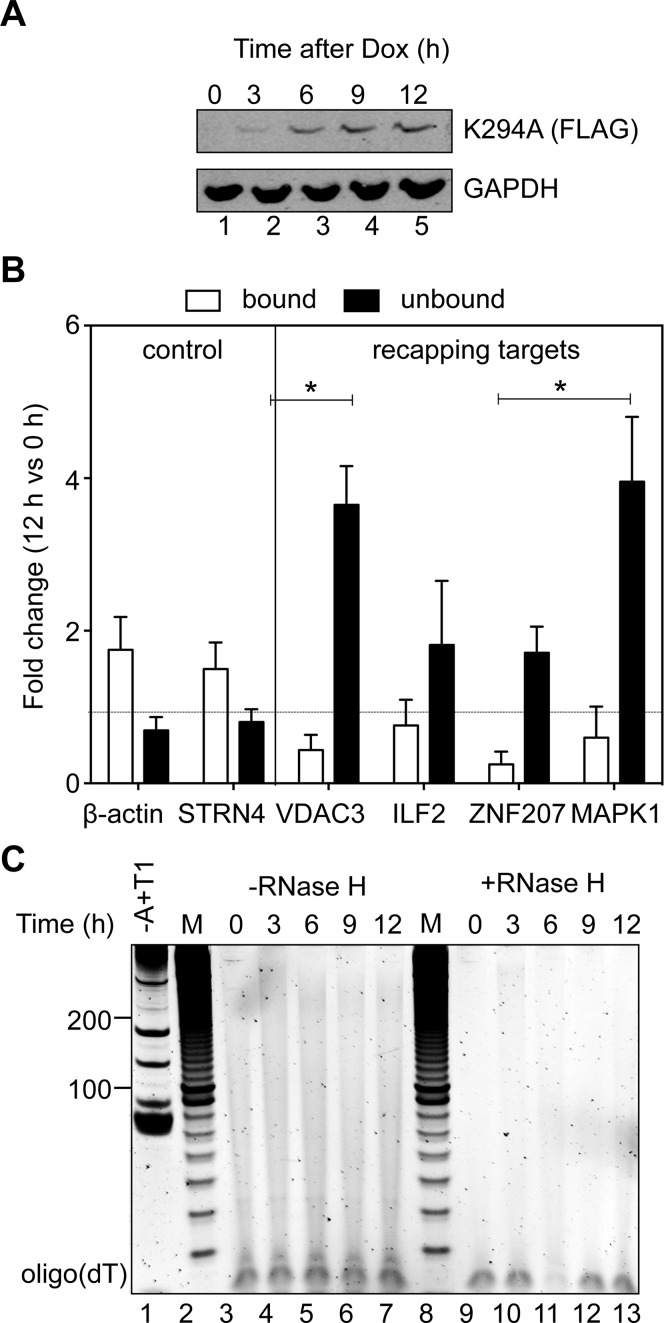
Appearance of uncapped transcripts and poly(A) length analysis as a function of time after K294A induction. (A) The appearance of K294A after induction with doxycycline was determined by western blotting with antibody to the C-terminal FLAG tag. (B) Cytoplasmic RNA from uninduced and 12 h K294A-expressing cells was depleted of ribosomal RNA and separated by cap affinity chromatography on Gst-Sepharose containing a bound Gst-eIF4E/Gst-eIF4G(197–674) heterodimer (12). Bound and unbound fractions were quantified by RT-qPCR and results are presented as the mean fold difference ± standard deviation of RNA from induced versus uninduced cells (n = 3). The star (*) indicates a p-value <0.05 by Student's t test. (C) 50 μg of cytoplasmic RNA recovered at each of the timepoints was left untreated (lane 1) or digested with a mixture of RNase A+T1 before addition of oligo dT20 in the absence (lanes 3–7) or presence (lanes 9–13) of RNase H. Lanes 2 and 8 (M) contains size standards beginning at 30 nucleotides.

