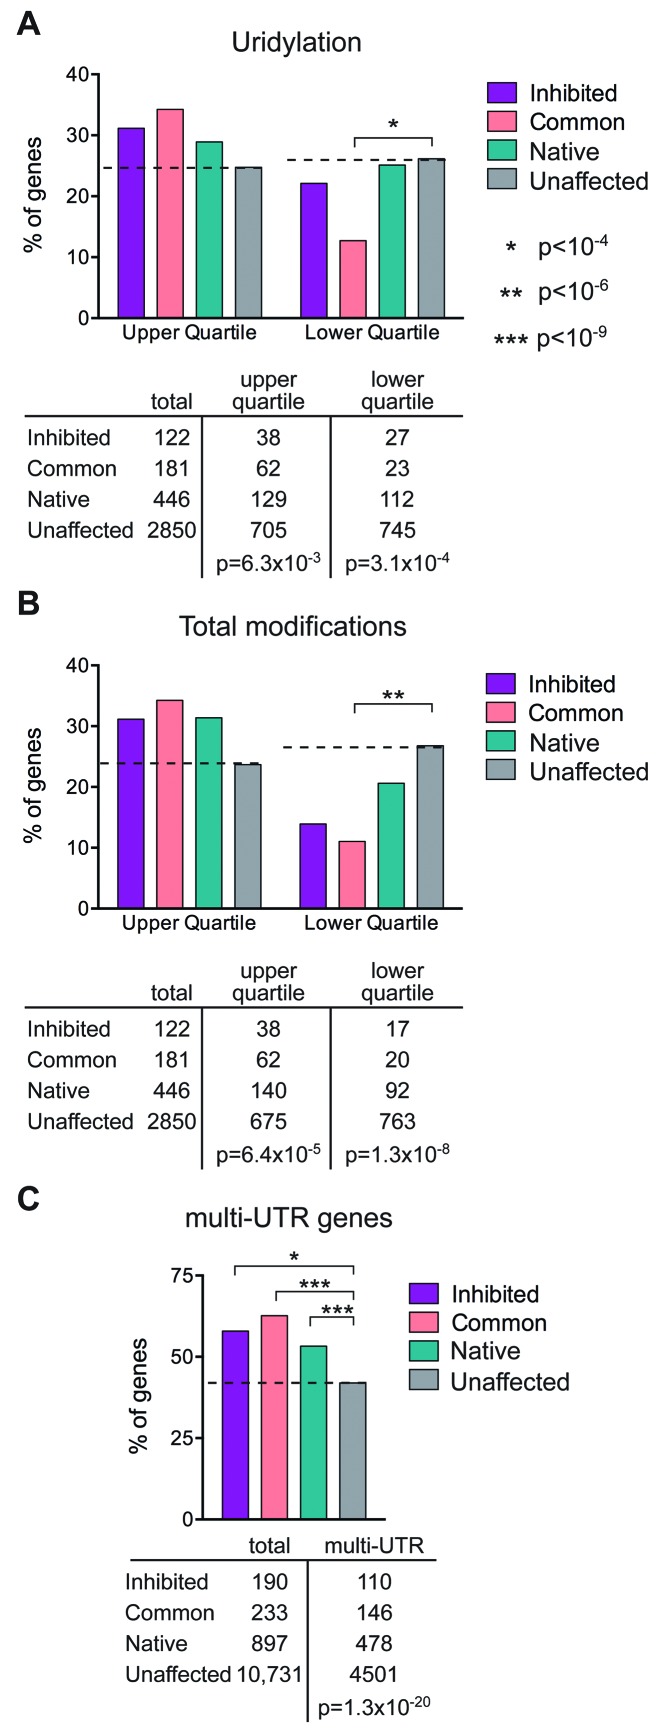
Figure 6.
Correlation between cytoplasmic capping targets, 3′-end modifications and multi-UTR genes. (A) The datasets of cytoplasmic capping targets in (12) and of 3′-end modified transcripts in (18) were converted to their respective Entrez gene IDs. The 4091 genes in the latter study were divided into the upper and lower quartiles for uridylated (1045 upper and 1058 lower) genes and the 3599 genes in common between the two studies were compared using Fisher's Exact Tests to determine the correlations between the three categories of cytoplasmic capping target sets and the upper and lower quartiles of uridylated Entrez gene ID lists. The dashed line indicates values for genes in (12) whose cap status is unaffected by inhibiting cytoplasmic capping. The number of genes in each category is shown beneath in tabular form together with the overall p-value for the upper and lower quartiles of uridylated transcripts. There was no correlation for guanylated transcripts. (B) The analysis in (A) was repeated for total modifications in (18) (1042 genes in the upper and 1033 genes in the lower quartile). (C) The list of 13 354 total and 5864 multi-UTR genes identified in (24) identified by their Entrez gene IDs were intersected with those of (12), and the 12 051 genes that were common to both studies were analyzed as in (A) for correlation between multi-UTR genes and each set of cytoplasmic capping targets.

