
Figure 2.
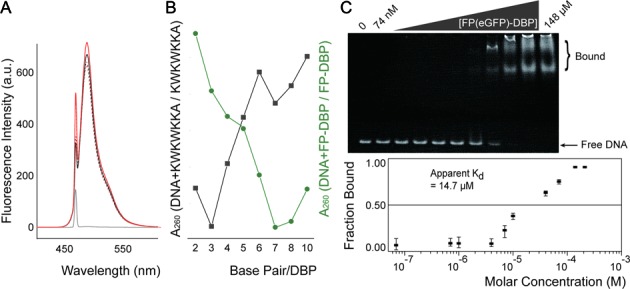
Characterization of FP-DBPs. (A) Fluorescence emission spectra of FP(eGFP)-DBP with oligonucleotide at 488 nm excitation. Spectra show fluorescence of FP(eGFP)-DBP with (red solid line) and without (black solid line) added oligodeoxynucleotides (0.5 μM, T9). As a control, eGFP without DBP (DNA-binding peptides) spectra were acquired in the presence and absence of oligodeoxynucleotides, shown here as dotted red and black lines, respectively. Gray solid line shows spectral data for just the oligonucleotide with no added FP-DBP. (B) Absorbance spectral ratios of DBP (KWKWKKA) with 52-mer DNA to DBP (grey) and FP-DBP with the same DNA to FP-DBP (green). The graphs indicate 3 base pairs per DBP, and 7 or 8 base pairs per FP-DBP. (C) Electrophoretic mobility shift assay (EMSA) estimates dissociation constant (Kd) of FP(eGFP)-DBP. Analysis of polyacrylamide gel electrophoresis data reveals the mobility shift of double stranded 52-mer DNA / FP(eGFP)-DBP complex. EMSA experiments were repeated three times, and the error bars show the minimum and maximum values for each data set. Fraction bounds were analyzed using FIJI software, and Kd was calculated by the least square method for each average value.