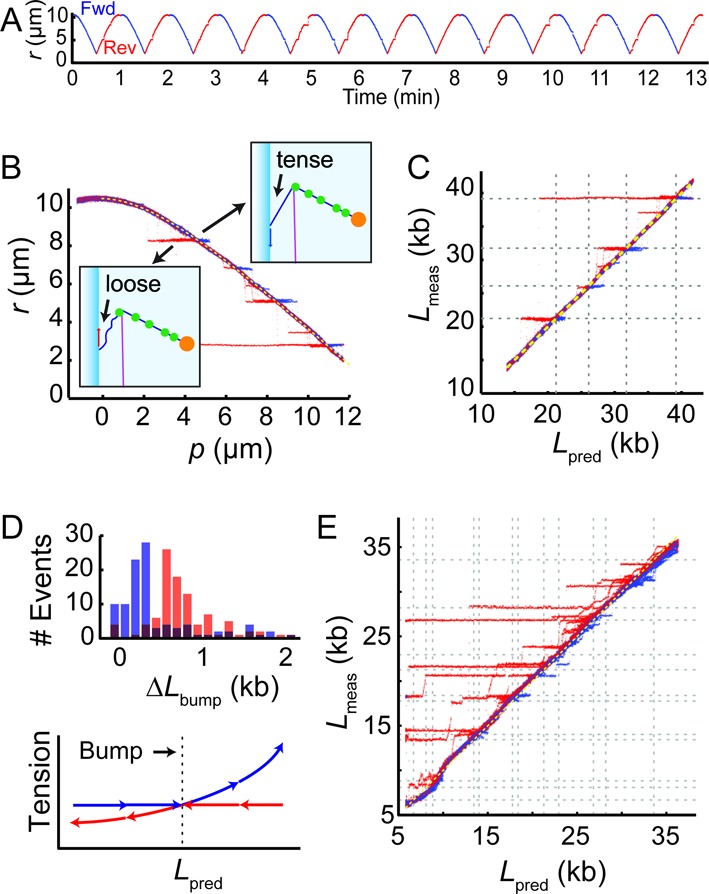
Figure 4.

Protein bumps on the DNA pulley. (A) Scanning experiments with EcoRI-incubated pulleys revealed reproducible pausing of the bead at specific sites. (B) The data in (A) were collapsed and plotted as a function of piezo coordinate p. The cartoons explain the difference in the induced tension between the forward and reverse scan. (C) Mapping of the pause locations onto the EcoRI recognition sites (dashed lines). (D) Top: histogram of pause sizes for forward and reverse scans. Here ΔLbump represents the absolute value of change in distance between the capillary-DNA junction and the DNA-blade junction during the interval in which the DNA is stuck (i.e. this would be the amount by which the DNA slid if it were sliding freely). Bottom: cartoon showing tension in the DNA segment between the capillary and the blade, before and after the EcoRI becomes hooked on the blade. In the forward scans, the tension increases after the EcoRI contacts the blade, while in the reverse scans the tension decreases. (E) Pauses in a molecule of λ-DNA incubated in EcoRV, mapped onto the EcoRV recognition sites (dashed lines).
