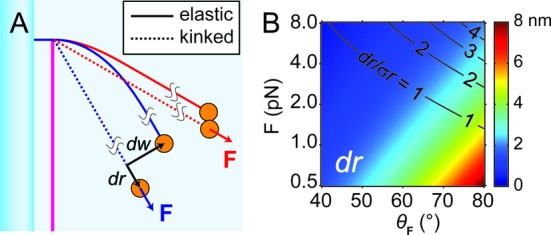
Figure 5.

Comparison between kinking and elastica model of DNA bending. (A) Cartoon of the DNA pulley comparing the two conformations: elastic bending (solid curve) and kinking (dotted line). The blue and red sets of lines show that the impact of kinking on bead displacements, dr and dw, depends on the direction of the applied force vector, F. (B) Calculation of dr for experimentally feasible range of F. |F| is the magnitude of the force, and  is the angle between F and x-axis. The ability to resolve length changes dr depends on the ratio of dr to the amplitude of the thermal fluctuations along
  , σr. Black contours indicate lines of constant dr/σr.
