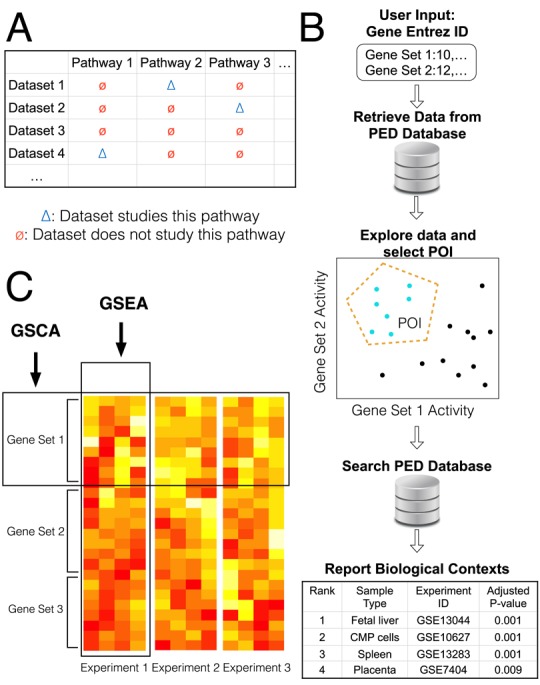
Figure 1.

Gene Set Context Analysis. (A) Data generated by one investigator for studying one pathway (blue triangle) may also contain information about other pathways (red circles). This information has not been fully utilized so far. (B) GSCA takes one or more gene sets as input. Users specify a combinatorial expression pattern of interest (POI) of these gene sets. GSCA then searches a large compendium of publicly available gene expression data and identifies all enriched biological contexts associated with the POI. (C) Comparison between GSCA and GSEA. GSEA analyzes thousands of gene sets sequentially in one data set, while GSCA analyzes one or multiple gene sets across massive amounts of samples from many data sets.
