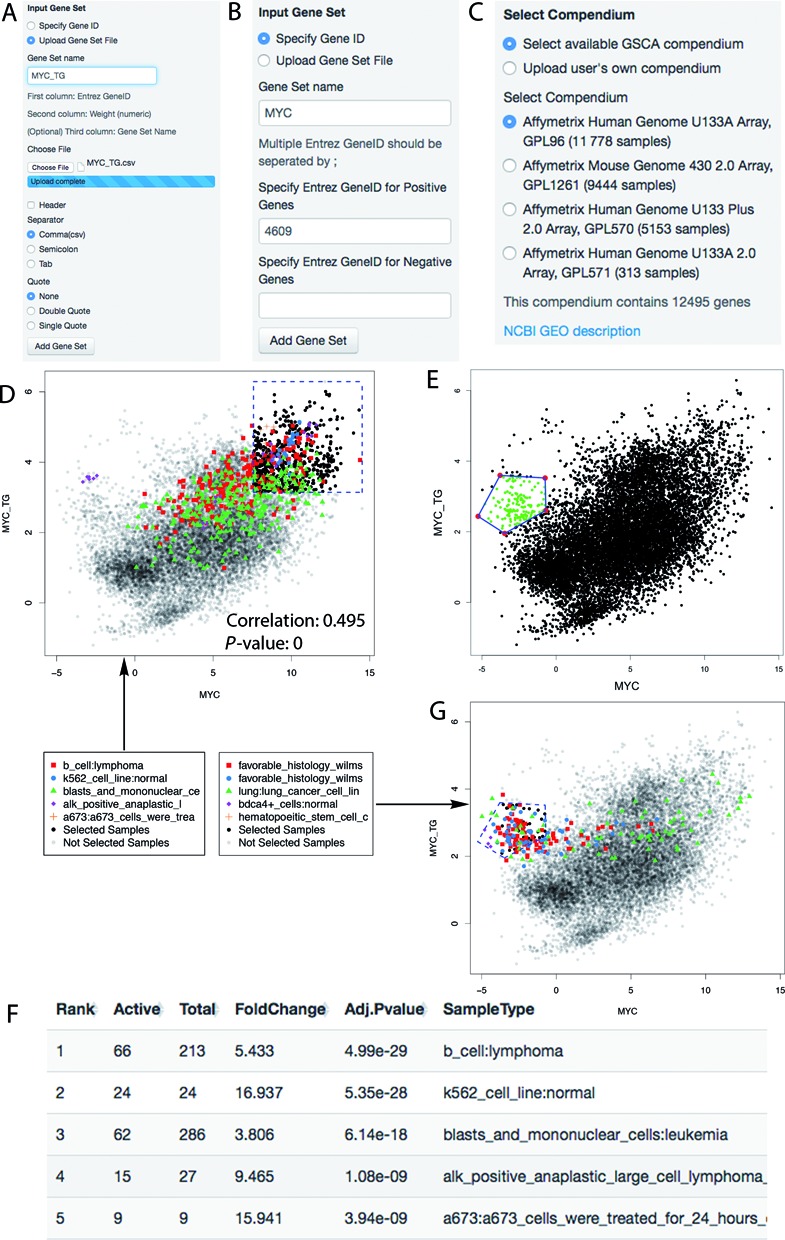
Figure 3.

GSCA demonstrated using the MYC example. (A) Panel for uploading gene set files. (B) Panel for inputting ENTREZ gene IDs. (C) Panel for selecting available compendia or uploading users’ own compendium. (D) GSCA scatter plot showing the default numeric POI. (E) POI defined interactively by drawing a polygon. (F) Ranking table reported by GSCA showing the top biological contexts associated with the numeric POI. (G) Scatter plot that highlights samples from five most significant biological contexts in the analysis of POI interactively specified in (E).
