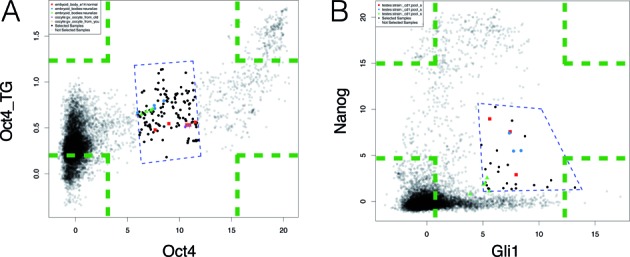
Figure 4.

Two examples comparing GSCA interactive POI and ChIP-PED POI. Green dashed lines represent four possible ChIP-PED POIs. Blue dashed lines define the interactive POI in GSCA. (A) Analysis of Oct4 and its target genes (Oct4_TG). (B) Analysis of Gli1 and Nanog.
