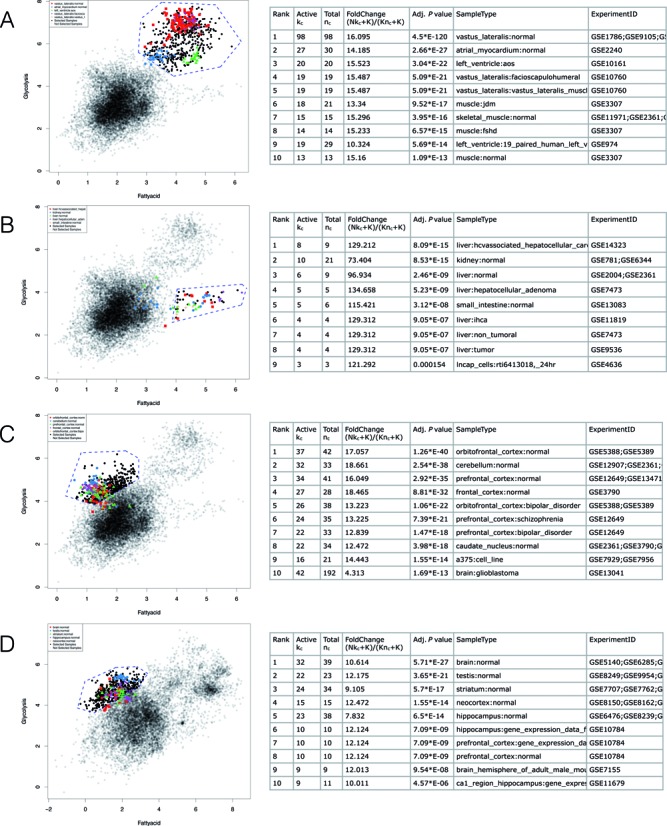
Figure 5.

GSCA applied to two metabolic gene sets: glycolysis and fatty acid oxidation. In each panel, blue dashed lines define the interactive POI, and the table shows contexts associated with the POI. (A) Analysis of high glycolysis and high fatty acid oxidation in human. (B) Medium glycolysis and high fatty acid oxidation in human. (C) High glycolysis and medium to low fatty acid oxidation in human. (D) High glycolysis and medium to low fatty acid oxidation in mouse.
