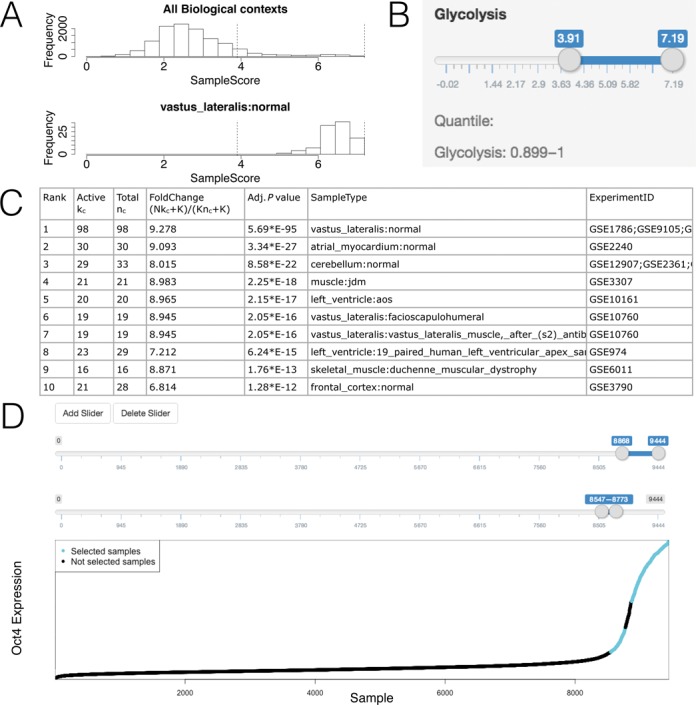
Figure 6.

GSCA for one gene set. (A) Histograms showing gene set activities across samples. (B) Sliders used to define POI. (C) Table showing the identified biological contexts. (D) Complex POI can be defined as the union of multiple intervals, specified interactively using multiple slider bars.
