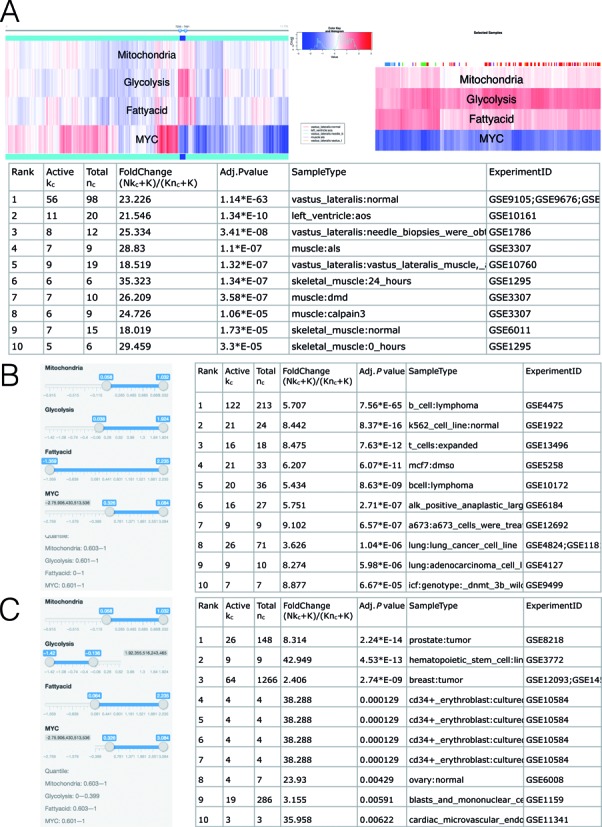
Figure 7.

GSCA for multiple gene sets. (A) Gene set activities across all PED samples are shown using a heat map (left). The sliders above the heat map can be used to interactively define POI. The heat map on the right provides a zoom-in view of the slider selected samples. The table below shows the identified biological contexts. (B) POI can also be defined by setting a numeric range for each gene set using sliders. This panel shows an analysis of high MYC, high mitochondria and high glycolysis activities. (C) High MYC, high mitochondria, high fatty acid and low glycolysis.
