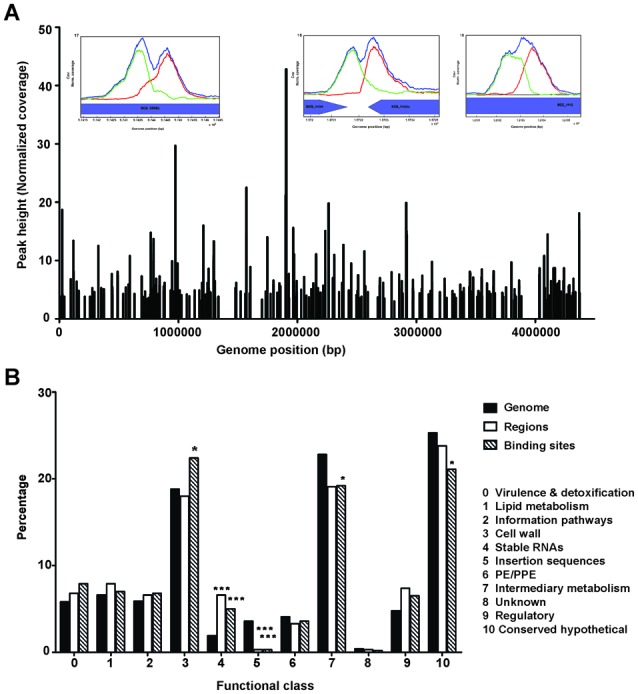
Figure 4.

Coverage and functional classification of Cmr binding sites. (A) Genome-wide distribution of Cmr binding sites obtained using ChIP-seq. Inset figures show bimodal peak plots at representative binding sites in/around Rv0846c (BCG_0898c), Rv1373c (BCG_1434) and Rv1057 (BCG_1115). (B) Functional classification of the ChIP-seq binding sites in various categories, as annotated in Tuberculist (http://tuberculist.epfl.ch/). ‘Genome’ is shown as a reference for the overall distribution of genes as annotated in the H37Rv genome. ‘Regions’ represents the percentages calculated using enriched regions to account for the effects of site clustering. ‘Binding sites’ refers to the distribution of all sites without accounting for the redundancy due to site clustering. Statistical significance was determined using hypergeometric calculations, with a correction factor of 11. *P < 0.05, **P < 0.005, ***P < 0.0005. Note that the Tuberculist annotations do not include all non-coding RNAs identified recently, and therefore have not been included in this analysis.
