Figure 7.

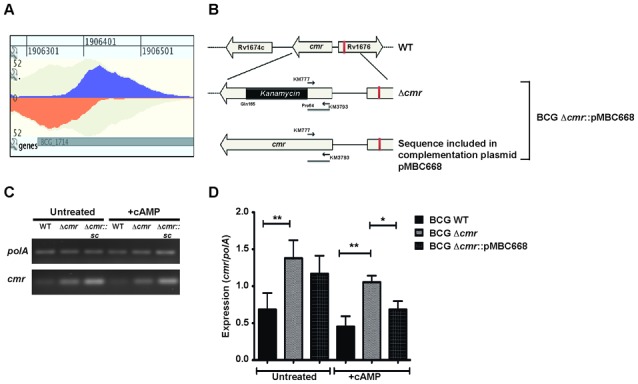
Autoregulation of cmr expression. (A) Bimodal peak plot from GenomeView showing Cmr binding site upstream of Rv1675c (BCG_1713c). The peak is centered 150 bp upstream of cmr translational start site and 60 bp into the open reading frame of divergent gene, Rv1676. In vitro binding of Cmr to this region is shown in Figure 6B. (B) Schematic map showing the genomic organization of the cmr locus in Mycobacterium bovis BCG and Mtb H37Rv WT, Δcmr and complementation strains. Black arrows indicate the primers used in semi-quantitative RTPCR. (C) Semi-quantitative RTPCR analyses showing relative expression of cmr in M. bovis BCG WT, BCGΔcmr and complementation strain, BCGΔcmr::pMBC668, under −/+ exogenous cAMP treatment conditions. The cDNA across samples was normalized to polA expression levels. A representative image from three biologically independent experiments is shown. (D) Quantitation of relative expression of cmr normalized to polA expression. Data presented as means ± S.E.M of three independent biological experiments, with technical duplicates. The asterisks above the bars indicate statistically significant difference calculated using two tailed, paired t-test. *P < 0.05, **P < 0.005.
